. 2017 Dec 27;139(51):18409-18427.
doi: 10.1021/jacs.7b08418. Epub 2017 Dec 15.

Origins of Enzyme Catalysis: Experimental Findings for C-H Activation, New Models, and Their Relevance to Prevailing Theoretical Constructs

Affiliations

Origins of Enzyme Catalysis: Experimental Findings for C-H Activation, New Models, and Their Relevance to Prevailing Theoretical Constructs

Judith P Klinman et al. J Am Chem Soc. .

Abstract

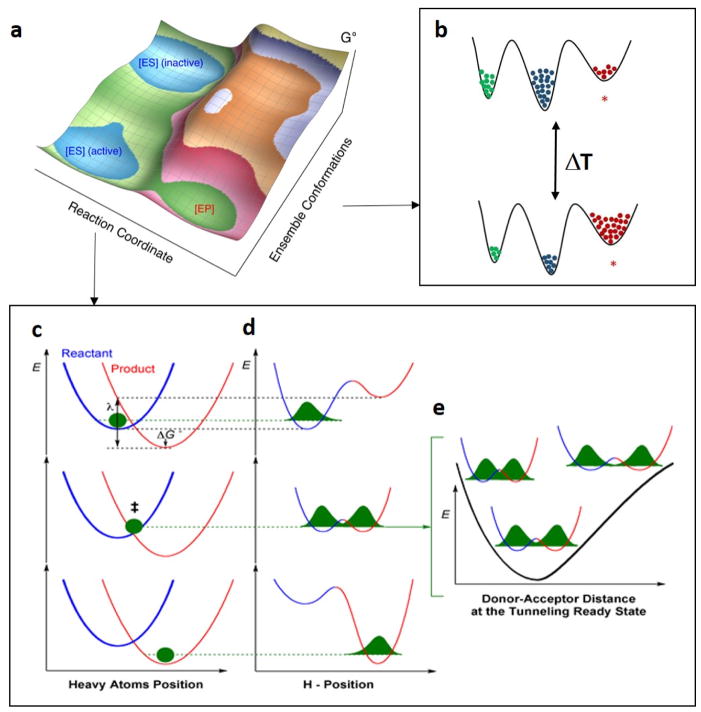
The physical basis for enzymatic rate accelerations is a subject of great fundamental interest and of direct relevance to areas that include the de novo design of green catalysts and the pursuit of new drug regimens. Extensive investigations of C-H activating systems have provided considerable insight into the relationship between an enzyme's overall structure and the catalytic chemistry at its active site. This Perspective highlights recent experimental data for two members of distinct, yet iconic C-H activation enzyme classes, lipoxygenases and prokaryotic alcohol dehydrogenases. The data necessitate a reformulation of the dominant textbook definition of biological catalysis. A multidimensional model emerges that incorporates a range of protein motions that can be parsed into a combination of global stochastic conformational thermal fluctuations and local donor-acceptor distance sampling. These motions are needed to achieve a high degree of precision with regard to internuclear distances, geometries, and charges within the active site. The available model also suggests a physical framework for understanding the empirical enthalpic barrier in enzyme-catalyzed processes. We conclude by addressing the often conflicting interface between computational and experimental chemists, emphasizing the need for computation to predict experimental results in advance of their measurement.


Conflict of interest statement

Notes: The authors declare no competing financial interest.

Figures

Figure 1
Figure 1
Structure of SLO and its active site. The two domains are color coded: wheat, N-terminal domain only present in human and plants, and light blue, C-terminal catalytic domain. The reactive portion of the substrate linoleic acid, pale green, has been modeled into the high resolution X-ray structure of SLO (3PZW; 1.4Å); the reactive carbon, C11, is colored black. The side chains discussed in the text are shown as pale yellow sticks. The ferric hydroxide cofactor is displayed as orange and red spheres, respectively. Side chains that ligate the catalytic cofactor are also shown.
Figure 2
Figure 2
Vibronic nonadiabatic tunneling model fits of the experimental KIE data for DM-SLO. The experimental data for the temperature dependence of the KIE (black circles with error bars) are shown in b), together with the theoretical curves for different sets of the equilibrium DAD, R0, and DAD sampling frequency, Ω (colored lines). The colors of the lines represent the RMSD (upper bar) calculated as the differences between the theoretically predicted and experimentally measured KIEs for the six experimentally measured temperatures for a given R0 and Ω. The mass of the DAD sampling mode was chosen to be 14 amu as determined in independent molecular dynamics (MD) simulations of WT SLO. The panel a) shows the data for RMSD<150 (colored dots using same color scheme for the RMSD as in b), in relation to all possible fits (grey background) with 500 cm−1 as the upper limit for Ω. In c) the Dkcat value at 30 °C is plotted vs the Ea value for WT (black), I553X series (green), L546A and L754A (blue), other double mutant L546A/I553A (orange), and double mutant L546A/L754A (red). The vertical dashed line represents an extrapolation of the temperature-dependence of WT (Ea = 0.9 kcal/mol). In d) the different patterns that connect the changes in R0 and Ω are shown. A close distance between the H-donor (D) and H-acceptor (A) is expected from the properties of WT SLO. Below and pointing left, the initial increase in R0 (and accompanying decreases in Ω) can be compensated by DAD distance sampling, allowing recovery to WT-like behavior. Below and pointing right, only R0 gets elongated while Ω remains the same or even increases, as in the case of DM-SLO. The tightness of the spring represents the frequency of DAD sampling.
Figure 3
Figure 3
Model for active-site ground-state structure of WT SLO ES complex. a) The distances represented by the red dotted lines are ENDOR derived distances; the Mn-O distance is obtained from the X-ray crystal structure, (2.23 Å). The angle, γ = 26°, was calculated from MD simulations using ENDOR derived distances as restraints. The position of 1Hb was not well established and it is arbitrarily pictured (in grey), for completeness. The purple dashed line represents ground state equilibrium DAD distance (Req) calculated trigonometrically. The uncertainty of the C11-O distances was estimated as ± 0.2 Å. Dashed blue circles suggest the oxygen nucleus lies out of the x-z plane of the ZFS axes. b) A physical picture for the tiers of distances relevant for bringing the DAD from Req to Rdom, where 2.7Å represents the dominant distance for efficient hydrogen transfer by tunneling. The numbers in italics refer to the DAD in Angstroms. A physical picture of protein motions linked to the conversion of Req to Rdom can be found in Figure 13.
Figure 4
Figure 4
Structural overlay of SLO (gray) and NspLOX (wheat). The SLO structure is from the high resolution X-ray model (1.4 Å) and the NspLOX model was generated from threading (Phyre) to a coral 8R-lipoxygenase. The loops unique to each structure are color coded: forest, SLO and navy blue, NspLOX.
Figure 5
Figure 5
The effect of elevated pressure on the empirical energy of activation (EaH) of kcat-H for WT, I553V, L546A, L754A, and L546A/L754A.
Figure 6
Figure 6
Room temperature X-ray structure of SLO showing active site residues that occupy alternative side chain conformations. The catalytic iron is represented by the dark gray sphere; carbons for all metal ligand side chains are shown in pale yellow. Side chains with alternate conformers are colored in salmon; L546 lies behind I553.
Figure 7
Figure 7
Three active site peptides in SLO (yellow) exhibit mutation-induced increases in the percent deuterium exchange at 4 h. In (a), two key active site residues are shown: L546 (red) and I553 (blue). In (b), the percent HDX at 4h and 30˚C for the representative peptide, 555–565, is plotted as a correlation to the kinetically determined ΔEa (see Table 1).
Figure 8
Figure 8
Correlated activation energies for HDXMS (317–334) and kcat in SLO. a) The Arrhenius-like plots of the weighted average exchange rates constants, ln(kHDX(avg)), for peptide 317–334, are compared for WT, I553G and L546A. b) The correlation between trend in Ea[kHDX(avg)] and Ea[kcat] (Table 1). c): Peptide 317–334, which exhibits mutant variable Ea[kHDX(avg)], is colored orange. The residues predicted to be involved in the pathway of communication from this loop to the active site are shown in green spheres; L546 and I553 side chains are also included in this pathway and colored red and blue, respectively. The catalytic iron is shown as a dark gray sphere. A hydrogen bonded interaction between S749 and Y317 is colored in salmon.
Figure 9
Figure 9
Functionally relevant temperature dependent breaks in behavior for ht-ADH. In (a), illustration of the kinetic break at 30 ˚C for both the kcat and the KIE (i.e. Dkcat). The KIE is almost temperature independent above 30 ˚C (red) and transitions to a more temperature dependent KIE behavior below 30 ˚C (blue) with a concomitant increase in Ea for kcat. In (b), HDXMS analysis revealed 5 peptides (1–4, 7) that show an analogous temperature dependent transition in k[HX(WA)]. In (c), these five peptides are numbered, mapped onto the ht-ADH structure and colored as red, orange, and magenta. The active-site Zn2+ is shown as a yellow sphere, adjacent to peptide 2, and the cofactor NAD+ is represented as yellow sticks.
Figure 10
Figure 10
Impact of mutation at V260 in ht-ADH. Panel (a) displays a focused view of active-site hydrophobic side chains (Leu176 and Val260) that sit behind the nicotinamide ring of cofactor. Upon mutation of V260 to alanine (b), the break in kinetic at 30 °C in the WT ht-ADH is enhanced and the active site has been rigidified, as illustrated by the reversal of the temperature dependence of the KIE, above and below 30°C from that of WT (Figure 9a).
Figure 11
Figure 11
Defined interfaces for transfer of thermal energy from solvated subunit-subunit interfaces to the active site in ht-ADH.
Figure 12
Figure 12
Key results from the time-resolved fluorescence studies on ht-ADH. For these studies, ht-ADH constructs were designed with one or two of the three native tryptophans substituted for phenylalanine side chains., Panel (a) shows the spatial location of these Trp residues (green sticks) with respect to the active site V260 (red) and Zn2+ (dark gray sphere). The NAD+ cofactor is represented in cyan sticks. Y25 at the subunit “Interface I” is shown for reference. Panel (b) presents the temperature dependent Stokes shifts (ps-ns timescale) that reveal two time constants, consistent with two conformations, for W87 fluorescence when the active site valine was mutated to alanine (V260A). Panels (c) and (d) show the temperature dependence of the fluorescence lifetime decay components for W87 (within the substrate binding domain) in WT and Y25A, correspondingly. A noticeable break at 30 °C is seen in the sub-nanosecond life time (black) in WT, but not for Y25A. Blue and red lines represent two longer, temperature independent components.
Figure 13
Figure 13
A general multidimensional model for hydrogen transfer in SLO and ht-ADH.,, (a) Schematic representation of a free-energy landscape for the enzyme-substrate complex, that takes into account both the reaction coordinate for H-transfer and a conformational landscape coordinate; only some fraction of the E-S complex (labelled active) is competent to carry out catalysis. (b) Cartoon model of a stochastic conformational landscape. The conformational sampling landscape of enzyme is represented by a solid black line, with increasing energy along the vertical axis. For the example, only three enzyme substates are shown and colored in green, blue and red. The substate colored in red is designated as the catalytically active configuration, and the other two states are either inactive or poorly active. The ΔT is to represent the impact of temperature on the conformational coordinate. Panels (c)-(e) show the three slices of the energy surface along the reaction coordinate defined by ktun (Eq 2). Panel (c) represents the motions of the heavy atoms of protein that optimize ΔG° and λ for hydrogenic wave function overlap between the reactant (blue) and product (red) potential wells. Panel (d) illustrates the hydrogen wave functional overlap that occurs upon reaching transient degeneracy between the reactant and product wells. Panel (e) presents the effective potential surface along the DAD coordinate at the tunneling ready state and illustrates the additional role of DAD sampling on the efficiency of wave function overlap.
Figure 14
Figure 14
Potential energy as a function of donor acceptor distance. For hydrogen transfer, this has been proposed to lead from transfer through the barrier (a) to an over-the-barrier process (b). As discussed in the text, while this scenario may, in certain instances, explain proton transfer between heteroatoms, it does not offer a theoretically-based explanation for the range of KIEs and their temperature dependencies observed in enzymatic C-H cleavage reactions.
Scheme 1
Scheme 1
Reaction mechanism for the peroxidation of long chain polyunsaturated fatty acids by soybean lipoxygenase. The first and rate limiting step is the hydrogen atom transfer from substrate to ferric hydroxide cofactor by a PCET process.
Scheme 2
Scheme 2
Generic reaction mechanism for the reversible oxidation of a primary alcohol by Zn(II)-dependent alcohol dehydrogenases. Proton transfer to a general base (B) accompanies the hydride transfer to NAD+.

Similar articles

Cited by

References

    1. Jencks WP. Binding energy, specificity, and enzymic catalysis: the circe effect. 1975. - PubMed
    1. Zhang XY, Houk KN. Acc Chem Res. 2005;38:379–385. - PubMed
    1. Walsh C. Enzymatic reaction mechanisms. W. H. Freeman; San Francisco: 1979.
    1. Frey PA, Hegeman AD. Enzymatic reaction mechanisms. Oxford University Press; Oxford ; New York: 2007.
    1. De Clercq E. Rev Med Virol. 2009;19:287–299. - PubMed

Publication types

LinkOut - more resources