. 2017 Dec 15;13(12):e1005892.
doi: 10.1371/journal.pcbi.1005892. eCollection 2017 Dec.

Optimal occlusion uniformly partitions red blood cells fluxes within a microvascular network

Affiliations

Optimal occlusion uniformly partitions red blood cells fluxes within a microvascular network

Shyr-Shea Chang et al. PLoS Comput Biol. .

Abstract

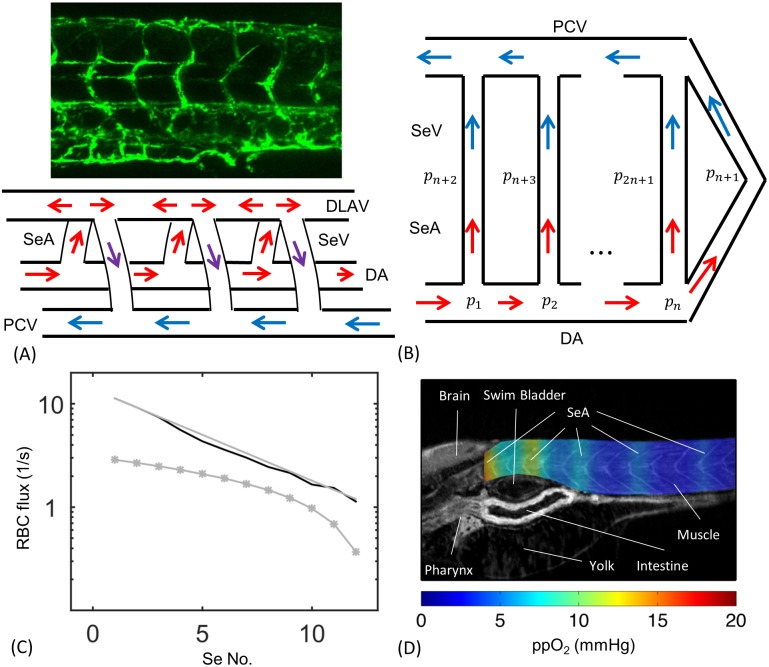
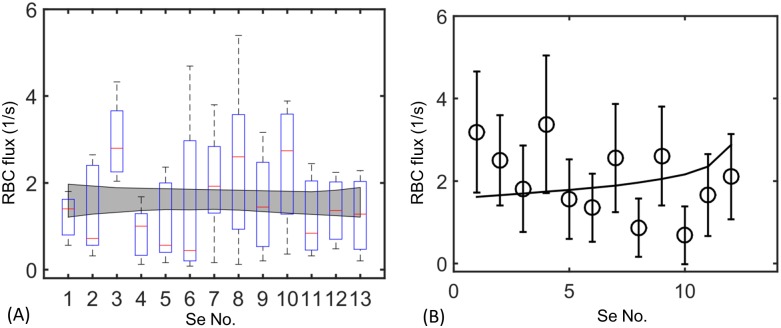
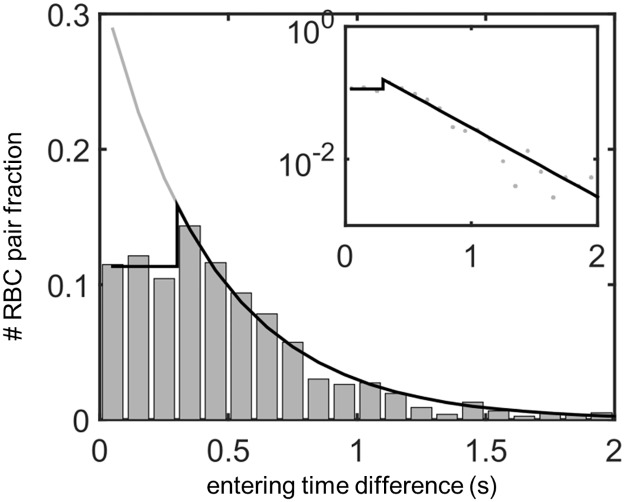
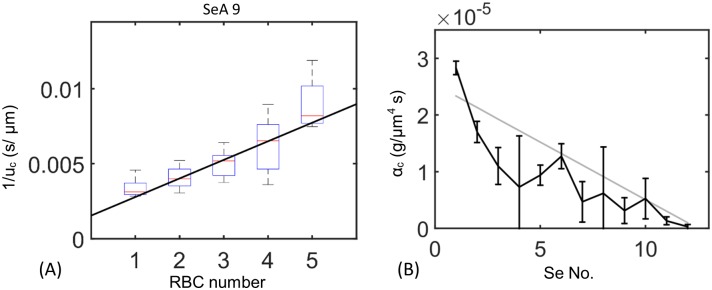
In animals, gas exchange between blood and tissues occurs in narrow vessels, whose diameter is comparable to that of a red blood cell. Red blood cells must deform to squeeze through these narrow vessels, transiently blocking or occluding the vessels they pass through. Although the dynamics of vessel occlusion have been studied extensively, it remains an open question why microvessels need to be so narrow. We study occlusive dynamics within a model microvascular network: the embryonic zebrafish trunk. We show that pressure feedbacks created when red blood cells enter the finest vessels of the trunk act together to uniformly partition red blood cells through the microvasculature. Using mathematical models as well as direct observation, we show that these occlusive feedbacks are tuned throughout the trunk network to prevent the vessels closest to the heart from short-circuiting the network. Thus occlusion is linked with another open question of microvascular function: how are red blood cells delivered at the same rate to each micro-vessel? Our analysis shows that tuning of occlusive feedbacks increase the total dissipation within the network by a factor of 11, showing that uniformity of flows rather than minimization of transport costs may be prioritized by the microvascular network.


Conflict of interest statement

The authors have declared that no competing interests exist.

Figures

Fig 1
Fig 1. The embryonic zebrafish trunk is perfused by a series of parallel intersegmental arteries (SeAs).
Hydraulic models for the network predict that the first of these SeA will short circuit flow through the trunk. (A) 4 day post-fertilization zebrafish embryo trunk network and wiring diagram showing PCV, DA and Se vessels in which SeA connect directly to SeV. (B) Representation of the same network as a set of hydraulic resistors. (C) A resistor network model predicts that cell fluxes decrease exponentially with distance from the heart (Black curve: numerical solution using real geometric parameters, Gray line: asymptotic model. For these two curves flow rates are multiplied by the concentration of red blood cell ρ = 0.003 μm−3 measured in [43]). By contrast an occlusive feedback model incorporating uniform occlusion strength αc = 1.01 × 10⁻⁶ g/μm4 s did not lead to more uniform distribution of red blood cell fluxes between vessels (Gray stars). (D) Anisotropic fluxes produce uneven oxygen perfusion within the trunk. Simulation results are superimposed on a zebrafish CT image reproduced from [53].
Fig 2
Fig 2. Measured cell fluxes in real zebrafish embryos are almost uniform across all microvessels.
(A) Measured fluxes in 6 4dpf zebrafish. Box-and-whisker plots show the mean measured fluxes for all 6 zebrafish, while the gray region is the envelope produced by bootstrapped regressions of flux against Se No., which is a numbering of Se vessels starting from the rostral trunk. (B) A model incorporating tuned occlusion strength (black curve) agrees well with the data from a single 4dpf zebrafish (black circles), see Results, Tuning occlusive effects …. Bars: standard deviation on flux.
Fig 3
Fig 3. Red flood cell flows in the real intersegmental artery network are affected by feedbacks, as shown by a significantly lower fraction of red blood cells entering the same vessel within 0.3s of each other.
Shown: Distribution of inter-entry times for cells entering all 12 SeAs. In the absence of feedbacks, inter-entry times will be exponentially distributed (black curve), while real inter-entry times follow an exponential distribution only when cells enter the vessel more than 0.3s apart, and have uniform distribution when cells enter the vessel within 0.3s of each other (black star curve). Inset: The semi-log plot of the linear-exponential distribution (black curve) fits well to the data (gray dots) above 0.3s, showing the exponential distribution when the inter-entry time is long enough for the first cell to leave the vessel. We bin the inter-entry time intervals into 0.1s bins which is the typical time resolution of our videos.
Fig 4
Fig 4. Occlusion of SeAs by cells feeds back onto the flow through the SeA.
(A) Eq 1 predicts that the reciprocal of cell velocity increases linearly with the number of cells in each Se vessel. Displayed: data from the 9th Se artery (Boxplot) and regression to determine feedback per cell, αc (curve). The y-intercept is determined from the theoretical plasma velocity in a network with no cells. For data from other Se arteries see S1 Text and S2 Fig. (B) Measured αc values decrease from first to last Se artery. Gray line: linear regression of αc against Se vessel index. Bars: 95% confidence intervals calculated by those of linear regressions.
Fig 5
Fig 5. A reduced vascular network model shows that occlusive effects need to be varied between SeAs, and exposes trade-offs between flow uniformity and transport efficiency.
(A) Diagram of the reduced model of the network showing vessel lengths li, fluxes Qi, and radii ri. (B) Increasing the occlusion strength α2 increases flux uniformity, measured by the ratio of fluxes in the last and the first Se (black curve), but also increases dissipation (gray curve), if the total flux through both Se vessels is maintained.
Fig 6
Fig 6. Tuned occlusion strengths uniformly distribute flow across different Se vessels.
(A) Dependence of flux uniformity upon controllable parameters is explored by allowing blood cell concentration, ρ, and difference in occlusive effects between first and last Se vessel, Δαc, to vary independently and computing the coefficient of variation (CV) for flow through all Se vessels. Flux uniformity is achieved only within a narrow manifold of values of blood cell concentrations and occlusive effect differences. The empirical values (red dot) lie close to this optimal manifold. (B) Higher uniformity can be achieved if blood cell concentration is decreased (moving leftward from the red dot) but at the cost of increasing dissipation. Transport costs are reduced if Δαc is decreased (moving downward), and can be reduced by 11-fold if there is no difference occlusive effect between different Se arteries but at the cost of reducing uniformity of RBC fluxes. Colors show CV values from (A) and white curves show level sets of dissipation; the dissipation is normalized by its value in the real zebrafish.

References

    1. Tomaiuolo G. Biomechanical properties of red blood cells in health and disease towards microfluidics. Biomicrofluidics. 2014;8(5):051501 doi: 10.1063/1.4895755 - DOI - PMC - PubMed
    1. West GB, Brown JH, Enquist BJ. A general model for the origin of allometric scaling laws in biology. Science. 1997;276(5309):122–126. doi: 10.1126/science.276.5309.122 - DOI - PubMed
    1. Savin T, Bandi M, Mahadevan L. Pressure-driven occlusive flow of a confined red blood cell. Soft matter. 2016;12(2):562–573. doi: 10.1039/C5SM01282A - DOI - PubMed
    1. Hall JE. Guyton and Hall textbook of medical physiology. Elsevier Health Sciences; 2015.
    1. Wan J, Ristenpart WD, Stone HA. Dynamics of shear-induced ATP release from red blood cells. Proceedings of the National Academy of Sciences. 2008;105(43):16432–16437. doi: 10.1073/pnas.0805779105 - DOI - PMC - PubMed

Publication types