. 2017 Dec 15;12(12):e0189741.
doi: 10.1371/journal.pone.0189741. eCollection 2017.

The ubiquitin-proteasome system is required for African swine fever replication

Affiliations

The ubiquitin-proteasome system is required for African swine fever replication

Lucía Barrado-Gil et al. PLoS One. .

Abstract

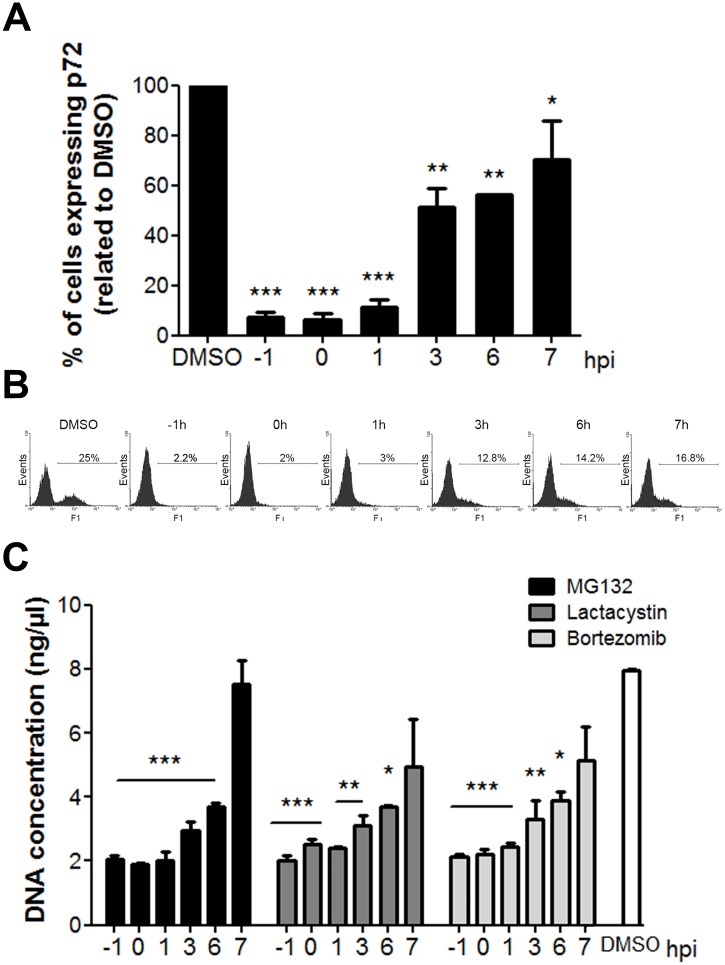
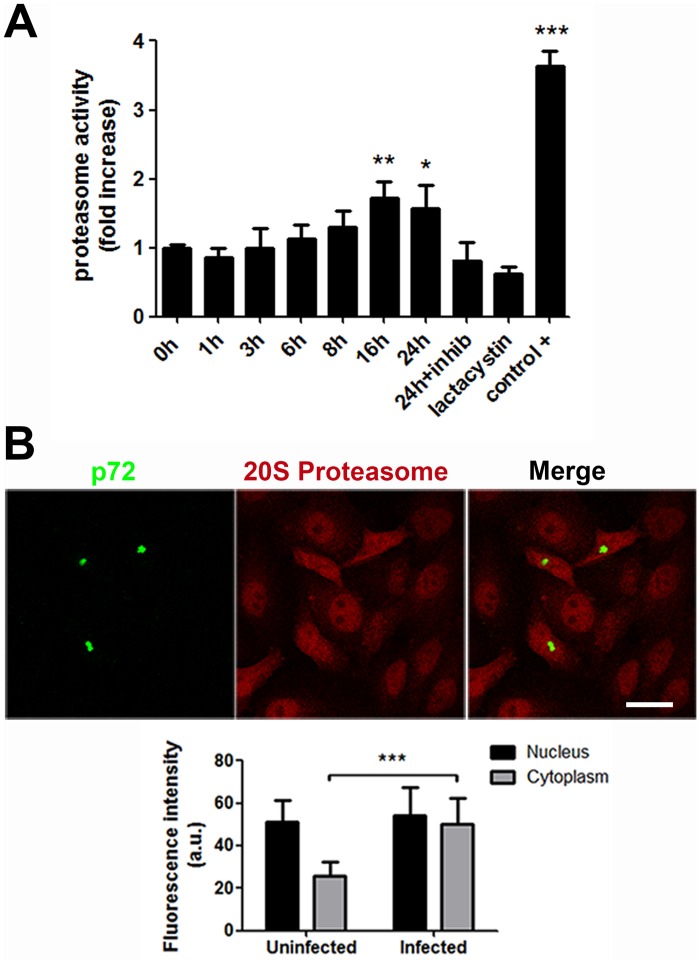
Several viruses manipulate the ubiquitin-proteasome system (UPS) to initiate a productive infection. Determined viral proteins are able to change the host's ubiquitin machinery and some viruses even encode their own ubiquitinating or deubiquitinating enzymes. African swine fever virus (ASFV) encodes a gene homologous to the E2 ubiquitin conjugating (UBC) enzyme. The viral ubiquitin-conjugating enzyme (UBCv1) is expressed throughout ASFV infection and accumulates at late times post infection. UBCv is also present in the viral particle suggesting that the ubiquitin-proteasome pathway could play an important role at early ASFV infection. We determined that inhibition of the final stage of the ubiquitin-proteasome pathway blocked a post-internalization step in ASFV replication in Vero cells. Under proteasome inhibition, ASF viral genome replication, late gene expression and viral production were severely reduced. Also, ASFV enhanced proteasome activity at late times and the accumulation of polyubiquitinated proteins surrounding viral factories. Core-associated and/or viral proteins involved in DNA replication may be targets for the ubiquitin-proteasome pathway that could possibly assist virus uncoating at final core breakdown and viral DNA release. At later steps, polyubiquitinated proteins at viral factories could exert regulatory roles in cell signaling.


Conflict of interest statement

Competing Interests: The authors have declared that no competing interests exist.

Figures

Fig 1
Fig 1. Effect of proteasome inhibitors on ASFV infection.
Percentages of ASFV Ba71V-infected cells analysed by flow cytometry at 16 hpi using monoclonal antibodies against early p30 (A) and late p72 (B) viral proteins. Vero cells treated with increasing doses of MG132 (0.1, 0.5 and 1 μM), Lactacystin (5, 10 and 20 μM) and Bortezomib (0.01, 0.1 and 0.5 μM) 1 h prior to infection or left untreated. Data normalised to controls were expressed as mean±SD of three independent experiments and compared to DMSO. Significant differences were marked with asterisks as indicated (**p<0.01; ***p<0.001). (C) Representative flow cytometry profiles of the % of cells expressing the late protein p72. (D) Cytotoxicity assay of inhibitors MG132 (1 μM), Lactacystin (20 μM) and Bortezomib (0.5 μM) used to select the non-toxic working concentrations. (E) Cell viability analysis by counting the number of cells with Trypan Blue stain. Cells were treated with the inhibitor MG132 (1 μM), Lactacystin (20 μM) and Bortezomib (0.5 μM) for 16h.
Fig 2
Fig 2. Analysis of proteasome inhibition on several infection parameters.
(A) Quantitation of ASFV viral DNA at 16 hpi in Vero cells pretreated 1 h with several concentrations of MG132, Lactacystin and Bortezomib. Data were compared to DMSO. Significant differences are marked with asterisks as indicated (*p<0.05; **p<0.01; ***p<0.001). (B) Representative western blot images of early p30 and late p72 expression in cells pretreated with MG132, Lactacystin and Bortezomib and infected with ASFV at 16 hpi. A sample WB image for MG132. Lactacystin and Bortezomib (from top to bottom) is shown. Quantification of the bands was corrected with tubulin data, normalised to controls values and compared to DMSO. Graphics depict mean±SD of densitometry values from three independent experiments. (C) Virus titration by plaque assay of Vero cells infected with recombinant virus BPP30GFP at a moi of 1 pfu/cell for 24 hpi in the presence of the inhibitor. (D) Representative confocal micrographs of Vero cells treated with 1 μM MG132 and infected with ASFV for 16h. Infected cells were labelled for viral protein p72 (green), which labels the viral factories, or early viral protein p30 (red), which shows a characteristic diffuse cytoplasmic staining. Bar = 10μm.
Fig 3
Fig 3. Proteasome inhibitors affected ASFV replication in porcine macrophages.
(A) A cytotoxicity assay of inhibitors MG132 (1 μM), Lactacystin (20 μM) and Bortezomib (0.5 μM) was used to select the non-toxic working concentrations. (B) Quantitation of ASFV viral DNA at 16 hpi in macrophages pretreated 1 h with 1μM MG132, 20μM Lactacystin and 0.05μM Bortezomib. Data were compared to DMSO. Significant differences are marked with asterisks as indicated (*p<0.05; **p<0.01; ***p<0.001).
Fig 4
Fig 4. Proteasome function is required at an early stage of infection.
(A) Time-course of ASFV infectivity under inhibition with MG132. Inhibitor was added either 1 h before (-1 hpi), at the time of infection (0 hpi) or at 1 to 7 hpi. Infectivity was measured as the percentage of cells expressing the late protein p72 at 16 hpi by flow cytometry. (B) Representative flow cytometry profiles of each time of treatment. (C) Quantification of viral DNA replication in Vero cells treated with MG132, Lactacystin or Bortezomib 1 h prior or 0 to 7 h after infection. Mean±SD correspond to three independent experiments. Differences are marked with asterisks as indicated (*p<0.05; **p<0.01; ***p<0.001).
Fig 5
Fig 5. Proteasome inhibition decreased core breakdown of ASF viral particles.
(A) Schematics show the disposition of virion layers. The outer capsid composed by ASFV p72 major capsid protein is represented in red colour and the inner core with the viral core protein p150 in green colour. Encapsidated virions would double label to both proteins in yellow while uncoated virions lose capsid staining and would single label in green. Empty virions positive for capsid protein p72 yielded a red signal. Representative confocal microscopy images of ASFV infected cells labelled for viral major capsid protein p72 (red) and inner core protein p150 (green). Cells were pretreated with 1 μM MG132, 200 nM Bafilomycin and infected for 3 hpi at a moi of 10 pfu/cell. Bar = 10μm (B) Number of intact cores (green) and encapsidated virions (yellow) per cells in each condition 3hpi. (C) Graphical representation showing the percentages of uncoated viral cores in cells treated with DMSO, MG132 and Baf normalized to the total number of virions counted in 50 cells per condition.
Fig 6
Fig 6. Proteasome activity increase at later times of the infection.
(A) Proteolytic activity evaluation at several times after ASFV infection by a proteasome activity assay. Fold changes at several times were compared with uninfected cell values. Also, a proteasome activity inhibitor (Lactacystin) and a very strong proteasome activity inducer were used as controls. (B) Representative confocal images of the distribution of 20S proteasome protein in uninfected or infected cells at 16 hpi. Viral factories (VF) stained with late ASFV protein p72 (green) and 20S proteasome protein (red). Bar = 10μm. Graph represents the fluorescence intensity of 20S proteasome in uninfected and infected cells measured using LAS Application quantification tool and a Leica TCS SPE confocal microscopy. Significant differences are marked with asterisks as indicated (*p<0.05; **p<0.01; ***p<0.001).
Fig 7
Fig 7. Pattern of poly- and monoubiquitination in ASFV infection.
(A) Lys48-UB (green) distribution in control and Ba71V ASFV-infected cells (red) at 16 hpi. In control cells, it was found in the nucleus while it distributed to the cytoplasm in infected cells. Staining for viral p30 was characteristically cytoplasmic while viral p72 accumulated at the viral replication site (red). A high magnification of the merged squared area is shown on the right hand side of the figure. (B) Lys63-UB accumulated around the viral replication sites or viral factories (VF) in infected cells compared to the dispersed distribution controls. Lys63-UB is shown in green and viral proteins in red. Higher magnification of the merged square area is shown on the right. Bar = 10μm.

References

    1. Rock KL, Gramm C, Rothstein L, Clark K, Stein R, et al. (1994) Inhibitors of the proteasome block the degradation of most cell proteins and the generation of peptides presented on MHC class I molecules. Cell 78: 761–771. - PubMed
    1. Thrower JS, Hoffman L, Rechsteiner M, Pickart CM (2000) Recognition of the polyubiquitin proteolytic signal. Embo J 19: 94–102. doi: 10.1093/emboj/19.1.94 - DOI - PMC - PubMed
    1. Mosesson Y, Shtiegman K, Katz M, Zwang Y, Vereb G, et al. (2003) Endocytosis of receptor tyrosine kinases is driven by monoubiquitylation, not polyubiquitylation. J Biol Chem 278: 21323–21326. doi: 10.1074/jbc.C300096200 - DOI - PubMed
    1. Haglund K, Dikic I (2005) Ubiquitylation and cell signaling. Embo J 24: 3353–3359. doi: 10.1038/sj.emboj.7600808 - DOI - PMC - PubMed
    1. Hoeller D, Crosetto N, Blagoev B, Raiborg C, Tikkanen R, et al. (2006) Regulation of ubiquitin-binding proteins by monoubiquitination. Nat Cell Biol 8: 163–169. doi: 10.1038/ncb1354 - DOI - PubMed

Substances

LinkOut - more resources