. 2017 Dec 14;171(7):1599-1610.e14.
doi: 10.1016/j.cell.2017.11.039.

Visualizing the Assembly Pathway of Nucleolar Pre-60S Ribosomes

Affiliations

Visualizing the Assembly Pathway of Nucleolar Pre-60S Ribosomes

Lukas Kater et al. Cell. .

Abstract

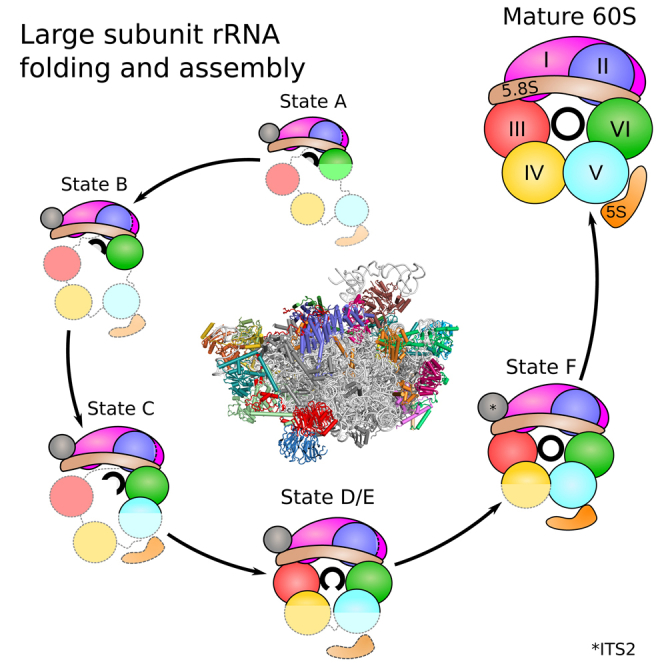
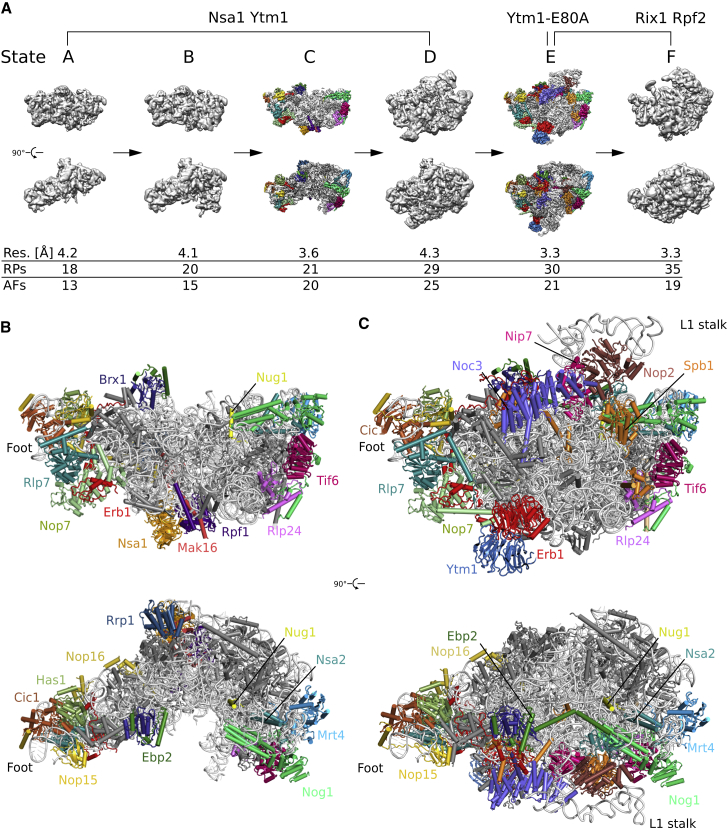
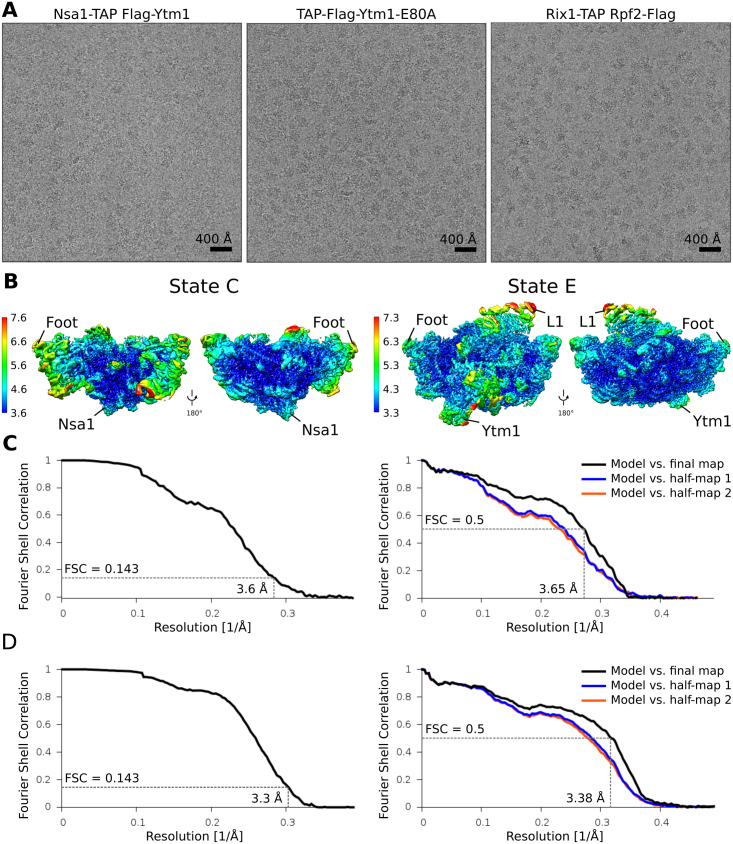
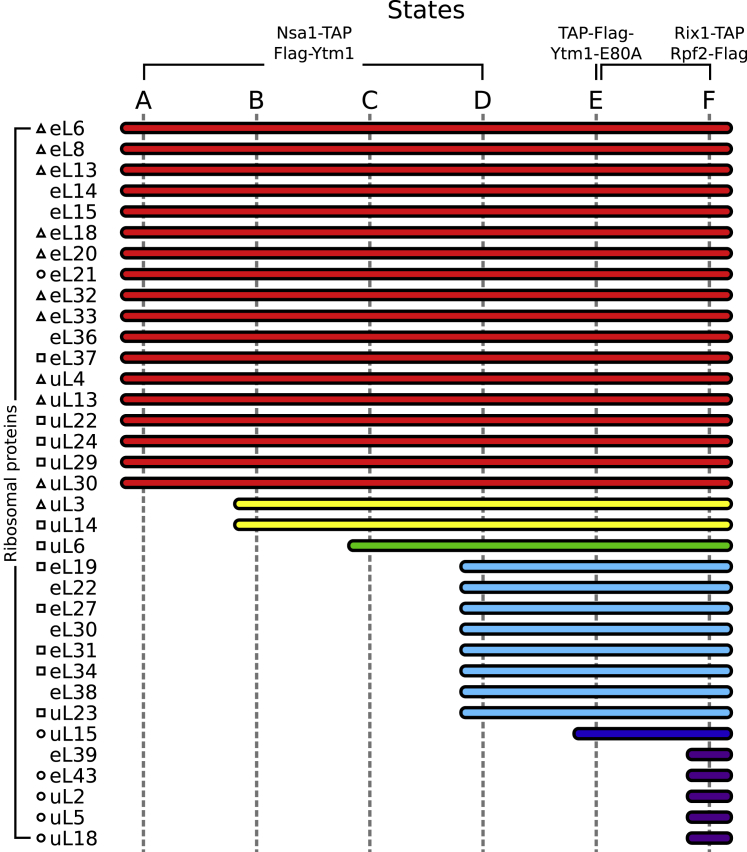
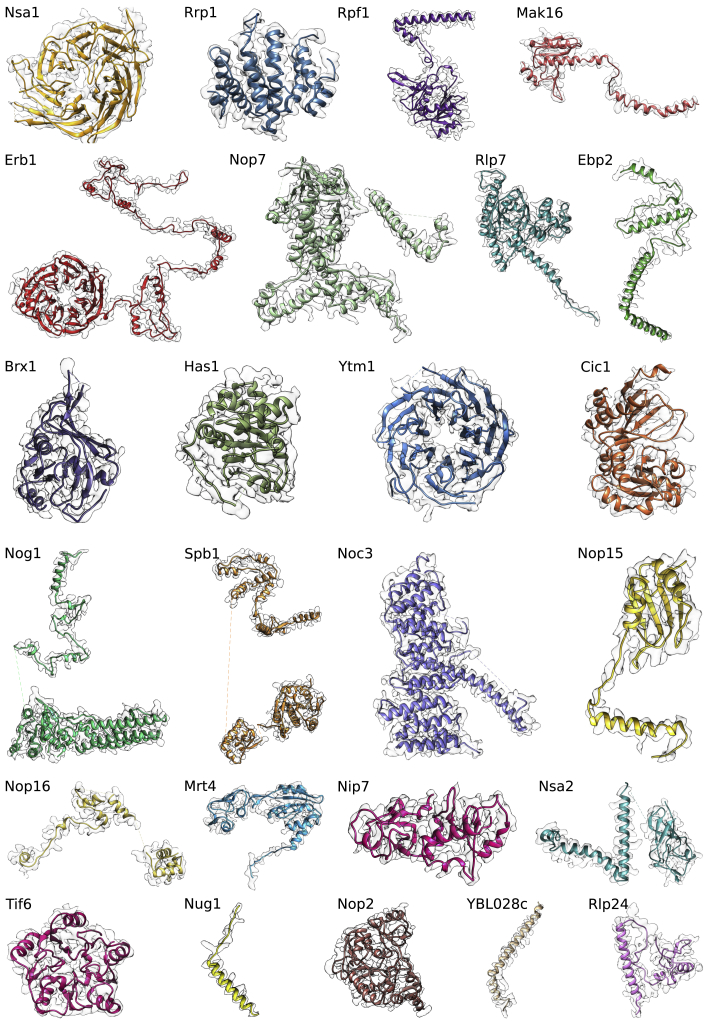
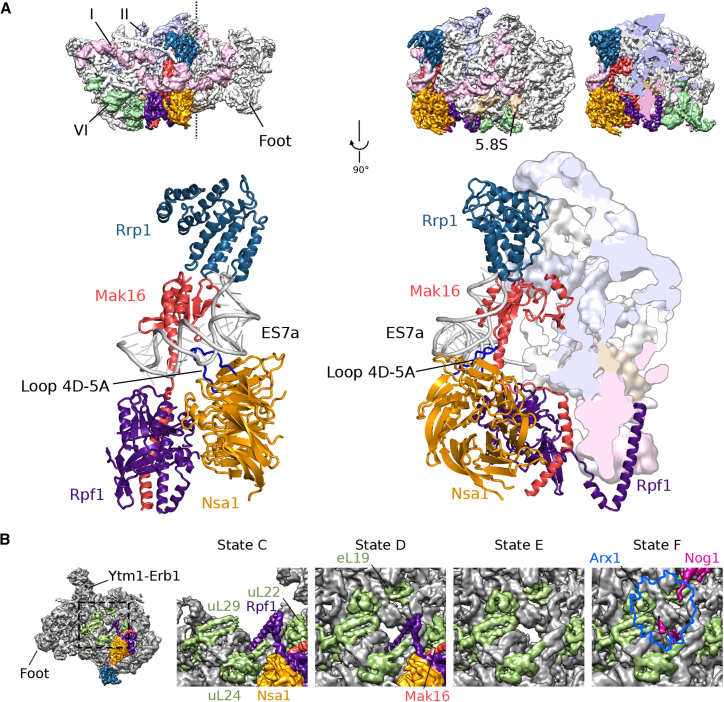
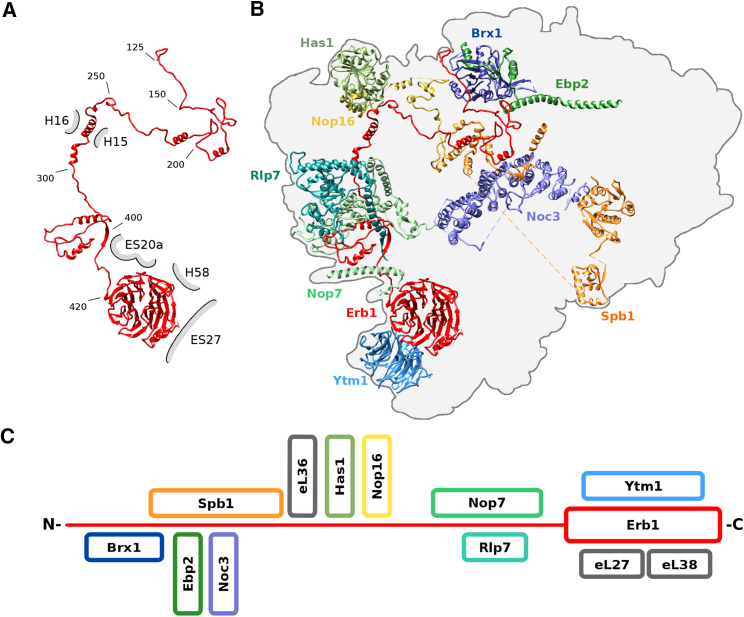
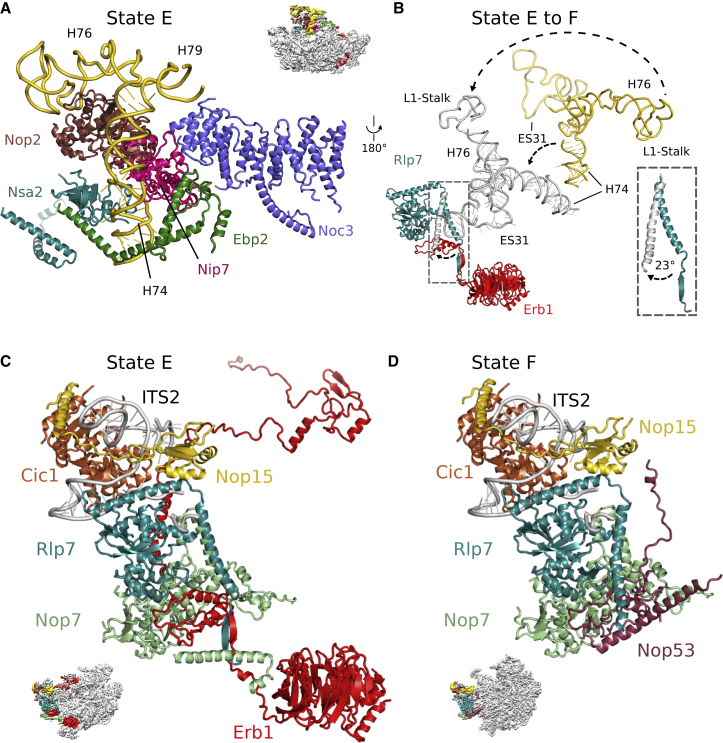
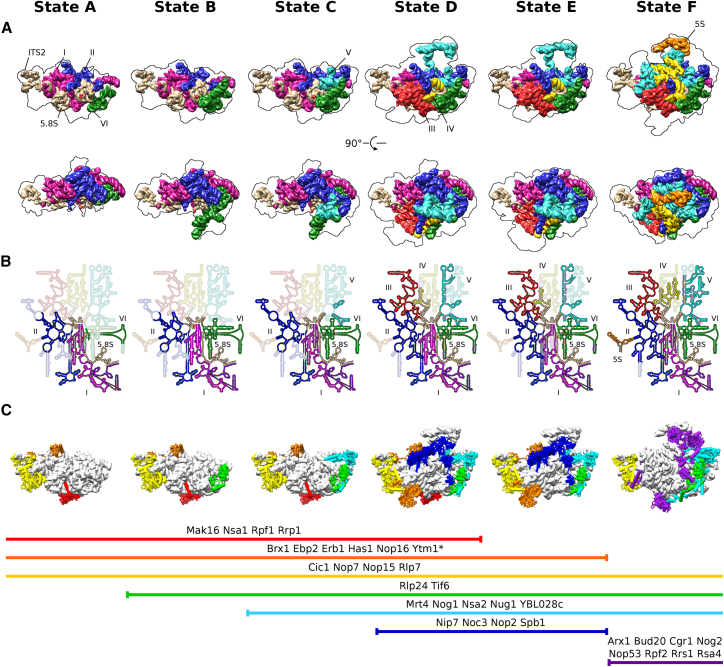
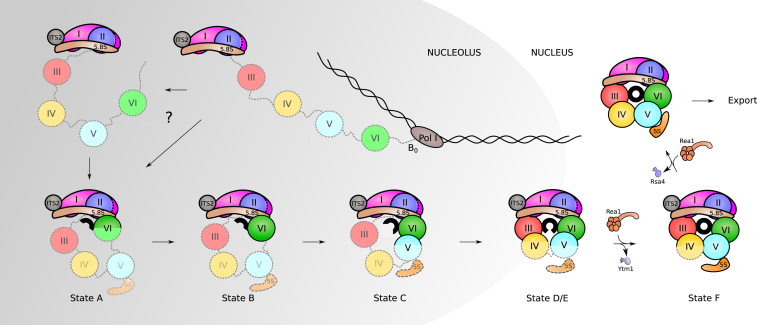
Eukaryotic 60S ribosomal subunits are comprised of three rRNAs and ∼50 ribosomal proteins. The initial steps of their formation take place in the nucleolus, but, owing to a lack of structural information, this process is poorly understood. Using cryo-EM, we solved structures of early 60S biogenesis intermediates at 3.3 Å to 4.5 Å resolution, thereby providing insights into their sequential folding and assembly pathway. Besides revealing distinct immature rRNA conformations, we map 25 assembly factors in six different assembly states. Notably, the Nsa1-Rrp1-Rpf1-Mak16 module stabilizes the solvent side of the 60S subunit, and the Erb1-Ytm1-Nop7 complex organizes and connects through Erb1's meandering N-terminal extension, eight assembly factors, three ribosomal proteins, and three 25S rRNA domains. Our structural snapshots reveal the order of integration and compaction of the six major 60S domains within early nucleolar 60S particles developing stepwise from the solvent side around the exit tunnel to the central protuberance.

Keywords: Erb1; Nsa1; assembly; cryo-electron microscopy; large subunit assembly; nucleolus; pre-60S; ribosome; ribosome biogenesis.


Figures

None
Graphical abstract
Figure 1
Figure 1
Cryo-EM Structures of Nucleolar Pre-60S Assembly Intermediates (A) Cryo-EM densities filtered to 10 Å in the case of states A, B, D, and F. Maps of states C and E are filtered to 3.6 Å with the identified biogenesis factors highlighted in color. Below each map, the overall resolution (res.), the number ribosomal proteins (RPs), and assembly factors (AFs), which are stably associated with the core particle and thus are resolved in the cryo-EM structures, are shown. The resolution of state E corresponds to the Ytm1-E80A particle-derived map. (B and C) Front and top views of the model of state C (B) and state E (C). rRNA and RPs are colored in light and dark gray, respectively. Biogenesis factors are highlighted in color. Helices 76–79 of the L1 stalk (C) are shown as backbone only and not included in the deposited model. See also Figures S2 and S4.
Figure S1
Figure S1
Affinity Purification of Nucleolar Pre-60S Particles for Cryo-EM Analysis, Related to Figure 1 (A and B) Split affinity purifications of pre-60S intermediates (upper panels) purified through Nsa1-TAP Flag-Ytm1 (A) and Rix1-TAP Rpf2-Flag (B). Final eluates were used for cryo-EM and analyzed by SDS-PAGE and Coomassie staining. Major protein bands were identified by mass-spectrometry and are labeled on the right side of the gels. The bait proteins are shown in bold and indicated by asterisks. The Rix1-TAP Rpf2-Flag purification purifies nucleolar (state E) and nucleoplasmic (state F) pre-60S particles (B). Nucleoplasmic assembly factors are indicated in green and the Rix1 subcomplex members (Rix1, Ipi3, Ipi1) in blue. Growth analysis (lower panels) of the Nsa1-TAP Flag-Ytm1 (A) and the Rix1-TAP Rpf2-Flag (B) strains in comparison to the untagged wild-type strain (DS1-2b). Cells were spotted in 10-fold serial dilution on YPD medium and cell growth at the indicated temperatures was monitored after 2 days. (C) Affinity purifications of the indicated plasmid-encoded Ytm1 variants fused to an N-terminal TAP-Flag tag and expressed from the endogenous promoter. The plasmids were transformed into a wild-type strain (W303). Final eluates of the purifications were analyzed by SDS-PAGE and Coomassie staining and co-purifying proteins are indicated on the right side of the gel and bands corresponding to the Ytm1 bait proteins are marked with an asterisk. Proteins decreased in the Ytm1 ΔUBL/E80A purifications compared to the Ytm1 wild-type particle are shown in red and factors increased on the mutant particles are indicated in green. (D) Affinity purification of the Ytm1 E80A particle used for cryo-EM analyzed by SDS-PAGE. Proteins bands were identified by mass-spectrometry and are labeled on the right side of the Coomassie stained gel.
Figure S2
Figure S2
Comparison of States C and E to the Mature 60S and Cryo-EM Processing Schemes, Related to Figure 1 (A) Pre-60S States C and D and the mature 60S (EMDB: 6478) (Passos and Lyumkis, 2015) showing the intersubunit side (left) and the solvent exposed side (right). (B–D) Cryo-EM processing schemes for the Nsa1-TAP Flag-Ytm1 (B), Rix1-TAP Rpf2-Flag (C), and the TAP-Flag-Ytm1 E80A (D) sample. Percentages indicate the fraction of total particles after 2D classification in a class or set of classes. Brackets indicate the joining of several highly similar classes.
Figure S3
Figure S3
Resolution Estimation and Model Validation, Related to Figure 1 (A) Exemplary micrographs of the three different biochemical samples. (B–D) Two views rotated by 180° of volumes of state C and E filtered and colored according to local resolution as provided by Relion-2.0 (Kimanius et al., 2016). Gold standard FSC-curves and FSC curves calculated between the cryo-EM maps and the models for the State C particle (C), and for the State E particle (D).
Figure S4
Figure S4
RP Composition of the Six Identified States, Related to Figure 1 RPs clustered and colored according to time of stable association with the core particle. RPs are marked with a triangle, square or circle according to depletion phenotypes leading to maturation arrests at early, middle, and late assembly stages, respectively (Gamalinda et al., 2014).
Figure S5
Figure S5
Gallery of All Modeled AFs, Related to Figures 1, 2, 3, and 4 AF models overlaid with the corresponding segmented map volumes. All AFs are taken from state E, except for Rrp1, Rpf1, Nsa1, and Mak16, which are taken from state C. Map densities are filtered to 3.3 Å and 3.6 Å for State E and C respectively.
Figure S6
Figure S6
CRAC Crosslinks and Crystal Structures, Related to Figure 2 (A) CRAC analysis hits of yeast Brx1 (blue, top plot) and untagged wild-type strain (red, top plot) as well as Rpf1 (black, bottom plot) and untagged wild-type strain (green, bottom plot). A schematic representation of the 35S pre-rRNA is drawn below the x axis. The number of hits per 1000 total mapped reads is plotted against the nucleotide position on the rDNA. (B) Comparison of the cryo-EM model (top) of Nsa1 with its crystal structure (bottom). (C) Comparison of the cryo-EM model (top) of Rrp1 with the crystal structure of Chaetomium thermophilum Rrp1 (bottom).
Figure 2
Figure 2
Nsa1 Module and Formation of the PET (A) Binding site of the Nsa1 module consisting of Mak16 (red), Nsa1 (orange), Rpf1 (purple), and Rrp1 (dark blue) bound to ES7a (light gray). A back and side view of the particle is shown. Densities for rRNA domains I, II, and VI as well as the 5.8S rRNA are, respectively, colored in light pink, purple, green, and beige. The vertical dashed line through the particle in the upper left view indicates the clipping plane for the cropped density. Loop 4D-5A, suggested to interact with the AAA-ATPase Rix7, is indicated in blue. (B) Maturation of the PET from states C–F. The N terminus of Rpf1 occupies the tunnel in states A–D; state E shows a free tunnel; and state F displays the C terminus of Nog1 residing in the tunnel.
Figure 3
Figure 3
Erb1 Functions as a Multivalent Interaction Hub (A) Overview of the Erb1 domain architecture showing the extended N terminus and the doughnut-shaped WD40 repeat domain. Interactions with rRNA are indicated in gray. (B) Localization of Erb1 in the state E particle (gray silhouette) with interacting AFs. (C) Schematic overview of protein contacts between Erb1 and other AFs and RPs.
Figure 4
Figure 4
Maturation of the L1-Stalk Segment Is Linked to “Foot” Remodeling (A) The L1 segment (rRNA helices H74–H79, gold) is stabilized in a pre-mature conformation by a set of AFs, including Ebp2 (green), Nip7 (magenta), Noc3 (purple), Nop2 (brown), and Nsa2 (turquoise). (B) The L1 segment undergoes large-scale conformational changes during maturation, which requires an outward rotation of the Rlp7 N-terminal α helix. The conformations as observed in states D and E of the L1 segment and Rlp7 are colored in gold and turquoise. Gray denotes their conformation as observed in state F. (A and B) Helices H76–H79 are displayed as backbone only and are not included in the provided model. In states D and E, the position of ES31 (gold, semi-transparent, backbone only) is indicated based on connectivity to helix H79, but not observed in the respective maps because of flexibility. (C and D) Structure of the “foot” in states E (C) and F (D). In state F, Nop53 takes the place of Erb1, resulting in a conformational change in the N terminus of Rlp7. The molecular interpretation of state F is based on the Arx1/Nog2 particle model (PDB: 3JCT) (Wu et al., 2016).
Figure 5
Figure 5
Sequential Incorporation of the rRNA Domains into a Developing Pre-60S Core Particle (A) Front and top views of structural rRNA representations based on Chimera molmaps for states A–F. The molmaps are color-coded by the rRNA domains: domain 0, ITS2, and the 5.8S rRNA portions are displayed in light brown; the 5S rRNA is in orange; domains I–VI are in magenta, blue, red, yellow, cyan, and green, respectively. (B) Secondary structure plots indicating folded rRNA for each state following the same color-code used in (A). (C) Schematic representation of AFs associated with all states. Clustering and coloration is based on the time point of stable association and dissociation from the maturing particle as indicated by the horizontal lines. () Ytm1 was clustered with Erb1, as the two proteins form a tight complex (Thoms et al., 2016, Wegrecki et al., 2015), and it was used as a bait protein to purify states A–D. It is therefore clear that Ytm1 is present in these states (A–D), but not yet stably localized in the core particle. The molecular interpretation of state F is based on the Arx1/Nog2 particle model (PDB: 3JCT) (Wu et al., 2016).
Figure 6
Figure 6
Assembly Sequence of the Pre-rRNA Domains Assembly of RPs and AFs to the nascent 35S rRNA precursor starts co-transcriptionally. Very early, the pre-rRNA is circularized as domain VI binds to domains I and II and the 5.8S portion of the precursor rRNA. The formation of the PET (displayed here as a black circle) starts with this circularization. Its maturation progresses as rRNA domains fold following this order: VI, V, III, and IV. Full assembly of the PET is only achieved when domain V is completely folded as observed in state F. After that, only few nucleoplasmic steps need to occur before the particles are exported to the cytoplasm, where they undergo final maturation.

References

    1. Afonine P.V., Grosse-Kunstleve R.W., Echols N., Headd J.J., Moriarty N.W., Mustyakimov M., Terwilliger T.C., Urzhumtsev A., Zwart P.H., Adams P.D. Towards automated crystallographic structure refinement with phenix.refine. Acta Crystallogr. D Biol. Crystallogr. 2012;68:352–367. - PMC - PubMed
    1. Amunts A., Brown A., Bai X.C., Llácer J.L., Hussain T., Emsley P., Long F., Murshudov G., Scheres S.H.W., Ramakrishnan V. Structure of the yeast mitochondrial large ribosomal subunit. Science. 2014;343:1485–1489. - PMC - PubMed
    1. Bai X.C., Fernandez I.S., McMullan G., Scheres S.H. Ribosome structures to near-atomic resolution from thirty thousand cryo-EM particles. eLife. 2013;2:e00461. - PMC - PubMed
    1. Barrio-Garcia C., Thoms M., Flemming D., Kater L., Berninghausen O., Baßler J., Beckmann R., Hurt E. Architecture of the Rix1-Rea1 checkpoint machinery during pre-60S-ribosome remodeling. Nat. Struct. Mol. Biol. 2016;23:37–44. - PubMed
    1. Bassler J., Kallas M., Pertschy B., Ulbrich C., Thoms M., Hurt E. The AAA-ATPase Rea1 drives removal of biogenesis factors during multiple stages of 60S ribosome assembly. Mol. Cell. 2010;38:712–721. - PMC - PubMed

Substances