. 2017 Dec 14;171(7):1678-1691.e13.
doi: 10.1016/j.cell.2017.11.009.

Combination Cancer Therapy Can Confer Benefit via Patient-to-Patient Variability without Drug Additivity or Synergy

Affiliations

Combination Cancer Therapy Can Confer Benefit via Patient-to-Patient Variability without Drug Additivity or Synergy

Adam C Palmer et al. Cell. .

Abstract

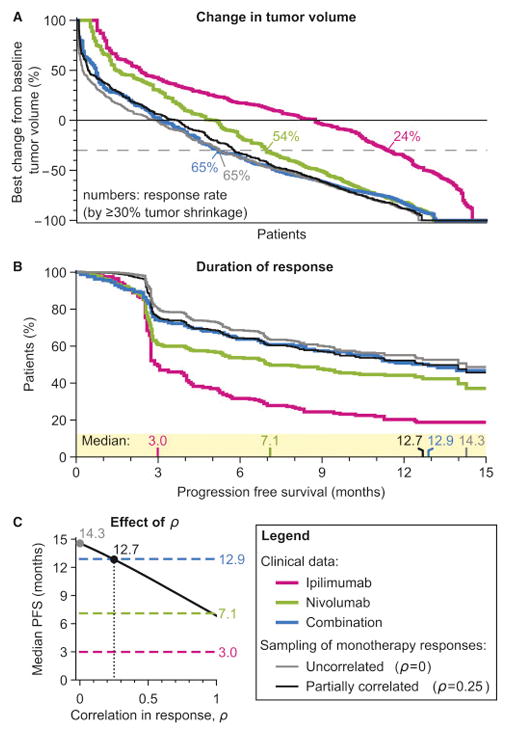
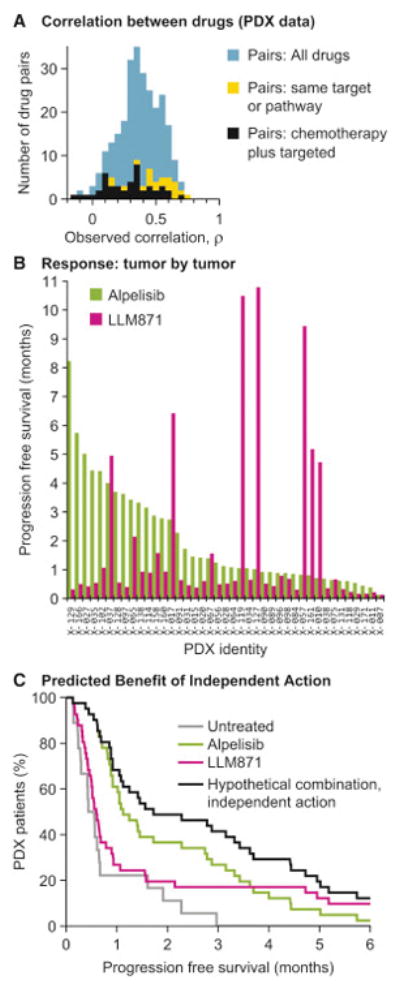
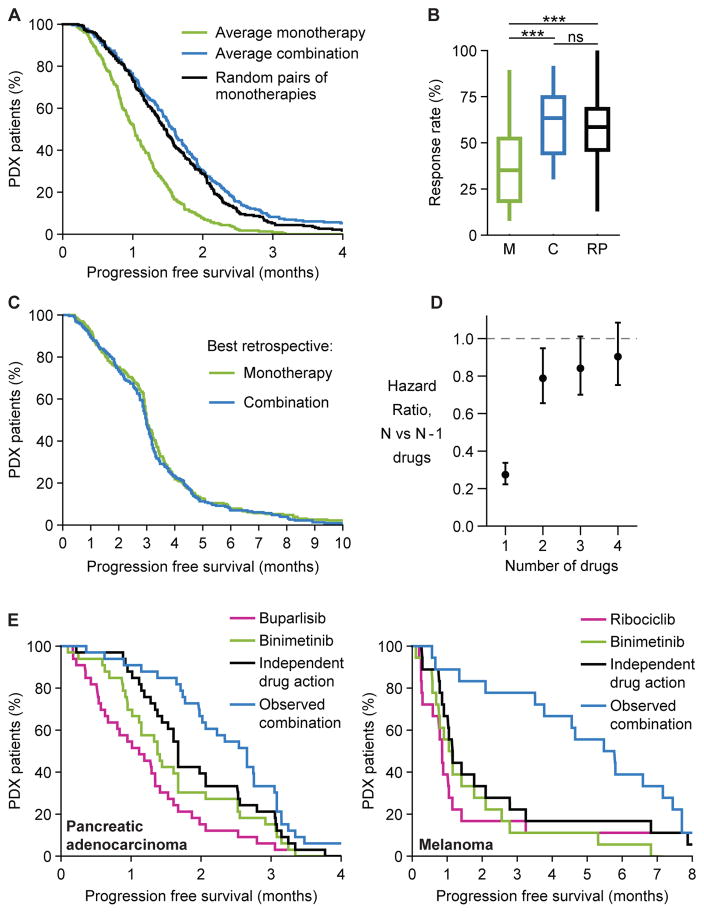
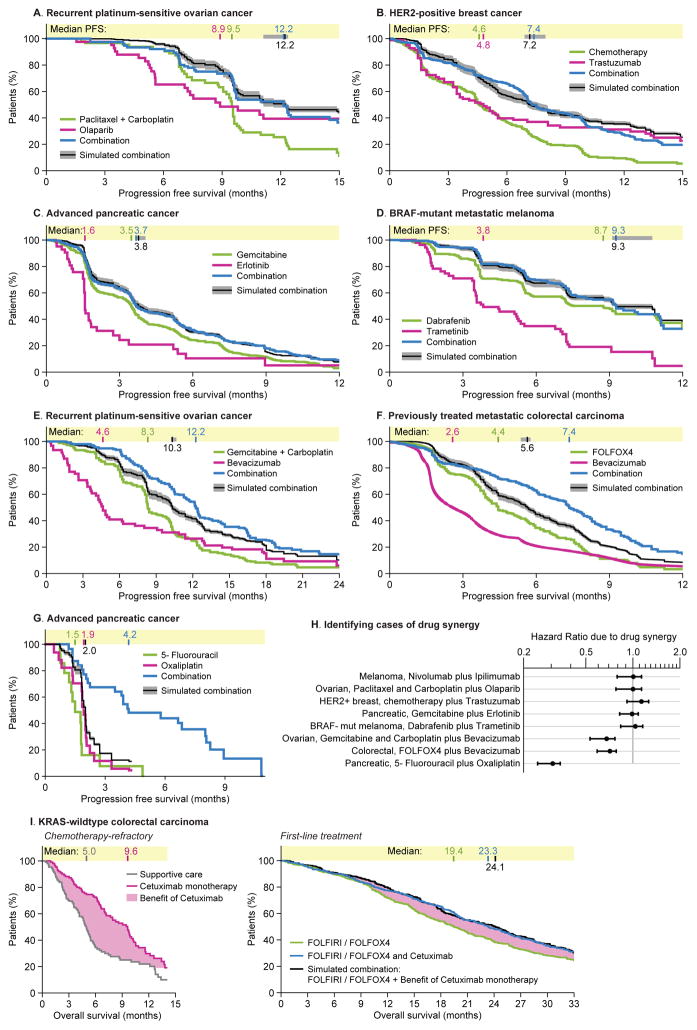
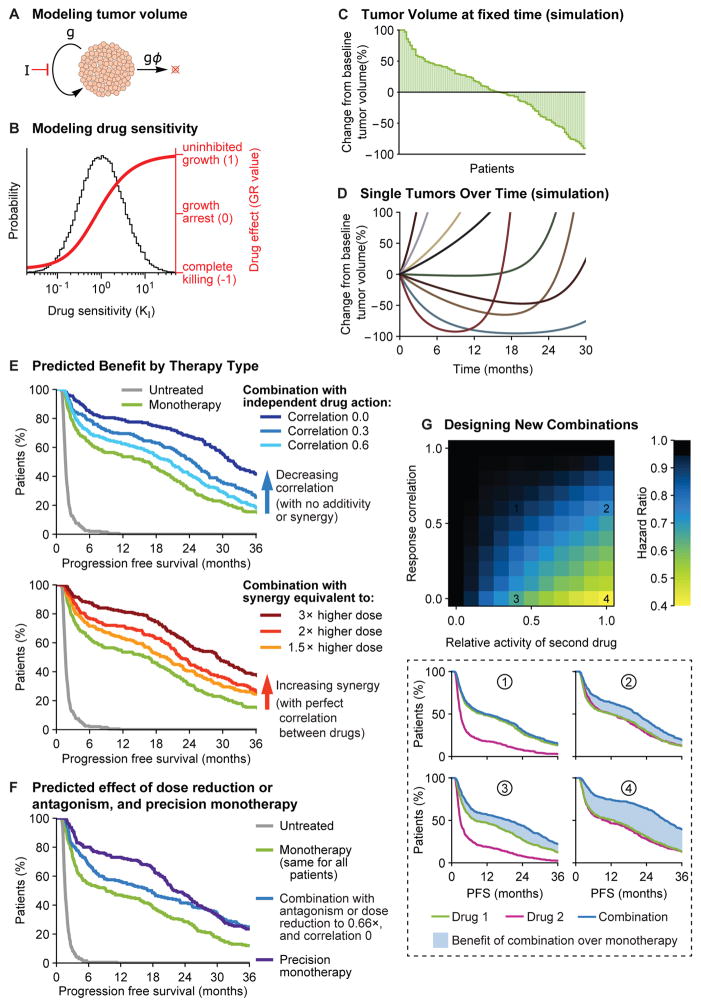
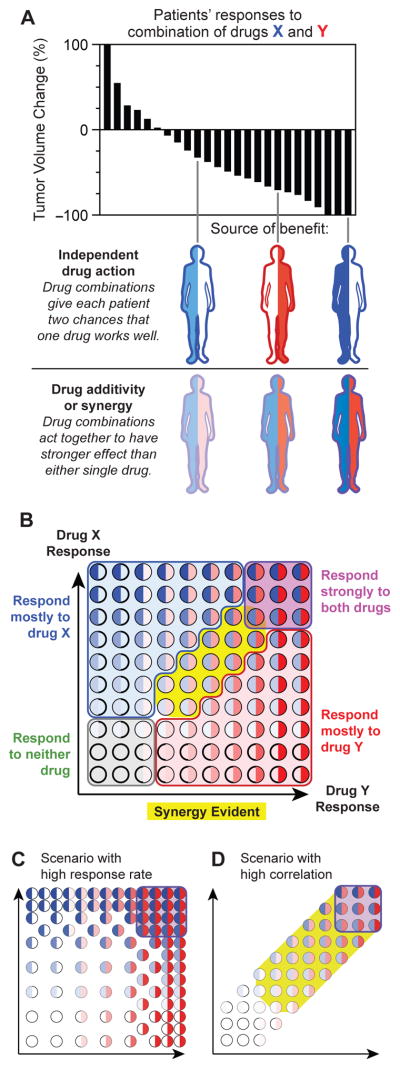
Combination cancer therapies aim to improve the probability and magnitude of therapeutic responses and reduce the likelihood of acquired resistance in an individual patient. However, drugs are tested in clinical trials on genetically diverse patient populations. We show here that patient-to-patient variability and independent drug action are sufficient to explain the superiority of many FDA-approved drug combinations in the absence of drug synergy or additivity. This is also true for combinations tested in patient-derived tumor xenografts. In a combination exhibiting independent drug action, each patient benefits solely from the drug to which his or her tumor is most sensitive, with no added benefit from other drugs. Even when drug combinations exhibit additivity or synergy in pre-clinical models, patient-to-patient variability and low cross-resistance make independent action the dominant mechanism in clinical populations. This insight represents a different way to interpret trial data and a different way to design combination therapies.

Keywords: cancer; clinical trials; combination therapy; drug synergy; mathematical modeling; patient-derived tumor xenograft; pharmacology; systems biology; tumor heterogeneity.


Figures

Figure 1
Figure 1. Responses to combination immunotherapy are consistent with benefit arising from variability in therapeutic response to constituent drugs
A. The response in a drug trial of human melanomas to nivolumab, or ipilimumab, or both in combination, as depicted by change from baseline tumor volume (a waterfall plot) or, B, duration of progression free survival (a Kaplan-Meier plot). Data from a Phase III trial by Larkin et al. (2015). Gray curve: responses of in silico patients with random sampling from the observed responses to individual drugs under the assumption of drug independence, where each patient’s response to a combination is their strongest monotherapy response. Black curve: sampling with responses assumed to be positively correlated with Spearman’s Rho = 0.25. C, The median progression free survival (PFS) predicted by independent drug action (black) depends on the degree of correlation in drug responses. Dashed lines: observed median PFS of monotherapies or combination. See also Figure S2, Data S1.
Figure 2
Figure 2. PDX data show that because different tumors respond to different drugs, independent drug action is sufficient for a combination therapy to improve response distribution in a population
A. Correlations in drug response (Spearman’s Rho applied to PFS) were calculated from PDX trials where the same tumors receive many different treatments (Gao et al., 2015) (Methods). B. Progression free survival measured by Gao et al. in 41 patient-derived gastric cancer xenografts, when treated with Alpelisib (PI3K inhibitor) or with LLM871 (FGFR2/4 antibody-drug conjugate). C. Probability of progression free survival in gastric cancer xenografts when treated with Alpelisib, or LLM871, or a hypothetical combination of the two drugs assuming independent action, where each tumor’s response is the best one of its observed responses to the two monotherapies. See also Figure S3, Data S1.
Figure 3
Figure 3. In PDX trial data independent drug action explains most of the benefit of combination therapy with rare exceptions of probable synergy
A. Probability of progression free survival over time, comparing each PDX’s average response to monotherapies (green) or average response to combinations (blue) (Gao et al., 2015). Choosing random pairs of monotherapies and assuming independent action (black) reproduces much of the observed benefit of combinations (no significant difference in hazard ratio). B. Box-whisker plot of response rates by RECIST (stable, partial or complete response) of all monotherapies (M), all combinations (C), or random pairs of monotherapies (RP); *** denotes p<10−5 by Kolmogorov-Smirnov test, ns denotes not significant. C. Survival distributions for the best observed response of each PDX to any monotherapy or to any combination are statistically indistinguishable. D. Hazard ratios (with 95% confidence intervals) from survival distributions that were computed, under the assumption of independent drug action, for multi-drug combinations in which each PDX is treated with the 0 to 4 most effective monotherapies for that tumor type. E. Progression free survival over time for a select few drug combinations and their constituent monotherapies, where combination responses that exceed independent drug action indicate additive or synergistic effects in individual tumors (Figure S4D displays all six cases). See also Figures S3, S4, Data S1.
Figure 4
Figure 4. Survival distributions observed in human clinical trials of combination therapies are similar to those expected for independent drug action given the observed variability in response to monotherapy
Human clinical trials of combination therapies were identified in which the efficacy of two drugs could be compared to the constituents alone at same or similar dosage (one ‘constituent’ could be a combination of fewer drugs) in patient cohorts with matching type and stage of disease. Progression Free Survival distributions under combination treatment were simulated assuming drug independence by sampling observed monotherapy responses with ρ = 0.28±0.20 (correlation range from PDX data, Figure 2A), which generates a range of predictions in gray. Data obtained from the following trials: A. Paclitaxel plus carboplatin, with or without olaparib (Oza et al., 2015); olaparib monotherapy (Liu et al., 2014). B. First-line chemotherapy (anthracycline plus cyclophosphamide, or paclitaxel only in event of prior adjuvant anthracycline), with or without trastuzumab (Slamon et al., 2001); first-line trastuzumab monotherapy (Vogel et al., 2002). C. Gemcitabine with or without erlotinib (Moore et al., 2007); erlotinib monotherapy in gemcitabine-resistant patients (Renouf et al., 2014). D. Dabrafenib with or without trametinib (Long et al., 2014); trametinib monotherapy (patient subset not previously treated with BRAF inhibitor) (Kim et al., 2013). E. Gemcitabine plus carboplatin, with or without bevacizumab (Aghajanian et al., 2012); bevacizumab monotherapy in platinum-resistant patients (Burger et al., 2007). F. Chemotherapy only (FOLFOX4: fluorouracil, leucovorin, and oxaliplatin), or bevacizumab only, or FOLFOX4 plus bevacizumab (Giantonio et al., 2007). G. 5-fluorouracil, oxaliplatin, or both (Ducreux et al., 2004). H. Benefits attributable to drug synergy were quantified as the Hazard Ratio of observed PFS with combination therapy versus PFS predicted with independent drug action. I. Pooled analysis of FOLFOX4 or FOLFIRI (fluorouracil, leucovorin, irinotecan) with or without cetuximab (Bokemeyer et al., 2012); cetuximab monotherapy for chemotherapy-refractory disease (Karapetis et al., 2008) (in all cases analyzing only KRAS-wildtype tumors). In this simulation the benefits of cetuximab monotherapy over supportive care were added to overall survival with first-line chemotherapy. See also Figures S2, S5, Table S1, S2, Data S1.
Figure 5
Figure 5. Using monotherapy trials to nominate drug combinations based on independent drug action
All possible pairs of monotherapies tested in PDX models by Gao et al. (2015) were simulated under the hypothesis of independent drug action, in which each xenograft’s response to a combination is the best of the two observed monotherapy responses. A. Histogram of hazard ratio for disease progression for all possible combinations compared to the overall best monotherapy for each tumor type. Bars are colored by p-value that Hazard Ratio < 1. B. Survival distributions for best predicted combinations, and observed survival with constituent monotherapies, for each of three tumor types (Figure 2 showed best prediction for gastric cancer). Left: Bar charts of PFS in each PDX. Right: survival curves observed for monotherapies and predicted for their combination. All projected improvements in response rate exceed what is expected from animal-to-animal variability reported by Gao et al. (all p-values < 0.05; Figure S6). C. PFS for the best observed monotherapies, best observed combinations, and best predicted combinations per tumor type for gastric, pancreatic, breast, and colorectal cancer. D. PFS for combination therapies predicted from a clinical trial comparing monotherapies for non-small cell lung cancer with ALK-rearrangement (Shaw et al., 2013). Simulations used response correlation ρ = 0.28 ± 0.20, as observed in PDX trials (Figure 2A). See also Figure S6, Data S1.
Figure 6
Figure 6. Simulations of patient heterogeneity in clinical trials show that independent drug action is similar in effect to additivity or synergy
A. A classic model of tumor kinetics involving competing processes of growth (g) and cell loss (). Treatment with inhibitor at dose [I] slows growth by (1+[I]/KI)−1. B. Drug sensitivity KI was taken to be log-normally distributed across a patient population (gray distribution). The effect of therapy on tumor proliferation at any given KI (red line) is quantified by the growth rate inhibition metric (GR) (Hafner et al., 2016). C. A simulated waterfall plot of changes in tumor volume after 8 weeks of monotherapy. D. Representative traces of tumor volume over time in individual tumors treated with monotherapy. Tumors are modeled with pre-existing drug resistant subclones that cause eventual progression. E. Progression free survival (time to tumor volume doubling) under mono- or combination therapies. A combination of independently acting drugs with benefit from patient-to-patient variability was modelled by assigning each tumor a KI for each drug, comparing low, medium, or high correlation between the drugs. Under independent action, tumor cells only respond to the most effective single drug (no additive effect). Additive or synergistic drug combinations were modeled as acting like a higher dose of monotherapy. F. Progression free survival time with a combination that requires dose reductions to 66% of single agent doses, equivalent to an antagonistic interaction with full doses. Precision monotherapy was modeled by treating each tumor with the best one of two drugs for that tumor. G. The hazard ratio of an independent drug combination, versus monotherapy, as a function of drug activity and response correlation between drugs. Lower panel: Progression free survival for each numbered scenario. See Figures S1, S7, Data S1.
Figure 7
Figure 7. When sensitivity to different drugs varies between patients, independent drug action is expected to confer clinical benefit and pharmacological additivity or synergy may have limited effect. A
Superior responses to combination therapy versus monotherapy have two possible explanations: two drugs could act together with additivity or synergy to induce stronger responses in individuals; or two drugs could improve the response distribution solely by independent action because some tumors are sensitive to the first drug and some other tumors more sensitive to the second drug. B. Wide variation in drug response, and low correlation in responsiveness to different drugs, predicts that most patients will benefit from combination therapy because of independent drug action. Each circle represents a tumor, with intensity of blue or red color indicating strength of response to each of two drugs. Most tumors primarily respond to one drug or neither. Additivity or synergy, if present, might be evident only in a minority of patients with partial response to each drug (yellow region). C. In situations with high response rates, more patients might experience synergistic benefit from two strong responses. D. In situations where responses to two drugs are highly correlated, as may occur with similar mechanisms of action, benefit may be more dependent on additive or synergistic effect.

Comment in

Similar articles

Cited by

References

    1. Aghajanian C, Blank SV, Goff BA, Judson PL, Teneriello MG, Husain A, Sovak MA, Yi J, Nycum LR. OCEANS: a randomized, double-blind, placebo-controlled phase III trial of chemotherapy with or without bevacizumab in patients with platinum-sensitive recurrent epithelial ovarian, primary peritoneal, or fallopian tube cancer. J Clin Oncol. 2012;30:2039–2045. - PMC - PubMed
    1. Berenbaum MC. What is synergy? Pharmacol Rev. 1989;41:93–141. - PubMed
    1. Berge EM, Lu X, Maxson D, Baron AE, Gadgeel SM, Solomon BJ, Doebele RC, Varella-Garcia M, Camidge DR. Clinical benefit from pemetrexed before and after crizotinib exposure and from crizotinib before and after pemetrexed exposure in patients with anaplastic lymphoma kinase-positive non-small-cell lung cancer. Clin Lung Cancer. 2013;14:636–643. - PMC - PubMed
    1. Bhang HE, Ruddy DA, Krishnamurthy Radhakrishna V, Caushi JX, Zhao R, Hims MM, Singh AP, Kao I, Rakiec D, Shaw P, et al. Studying clonal dynamics in response to cancer therapy using high-complexity barcoding. Nat Med. 2015;21:440–448. - PubMed
    1. Bokemeyer C, Van Cutsem E, Rougier P, Ciardiello F, Heeger S, Schlichting M, Celik I, Kohne CH. Addition of cetuximab to chemotherapy as first-line treatment for KRAS wild-type metastatic colorectal cancer: pooled analysis of the CRYSTAL and OPUS randomised clinical trials. Eur J Cancer. 2012;48:1466–1475. - PubMed