. 2017 Aug 24;8(59):99567-99579.
doi: 10.18632/oncotarget.20433. eCollection 2017 Nov 21.

RUNX1 promote invasiveness in pancreatic ductal adenocarcinoma through regulating miR-93

Affiliations

RUNX1 promote invasiveness in pancreatic ductal adenocarcinoma through regulating miR-93

Yin Cheng et al. Oncotarget. .

Abstract

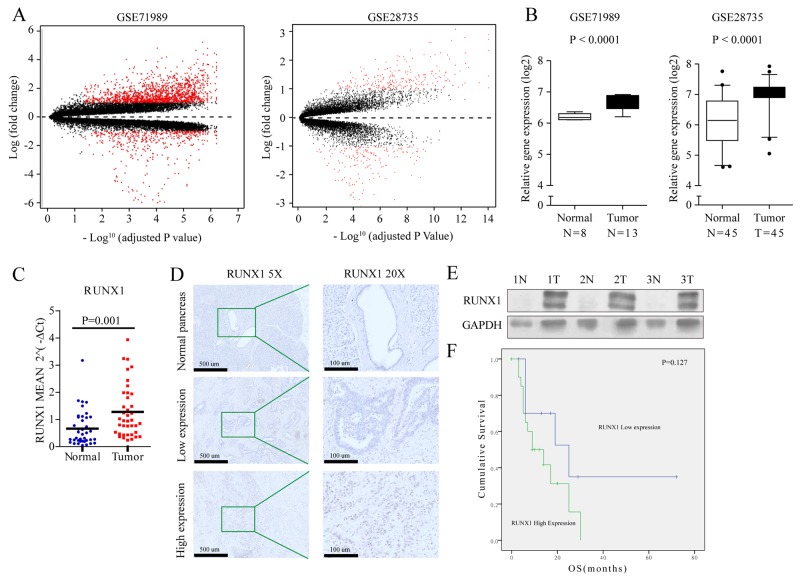
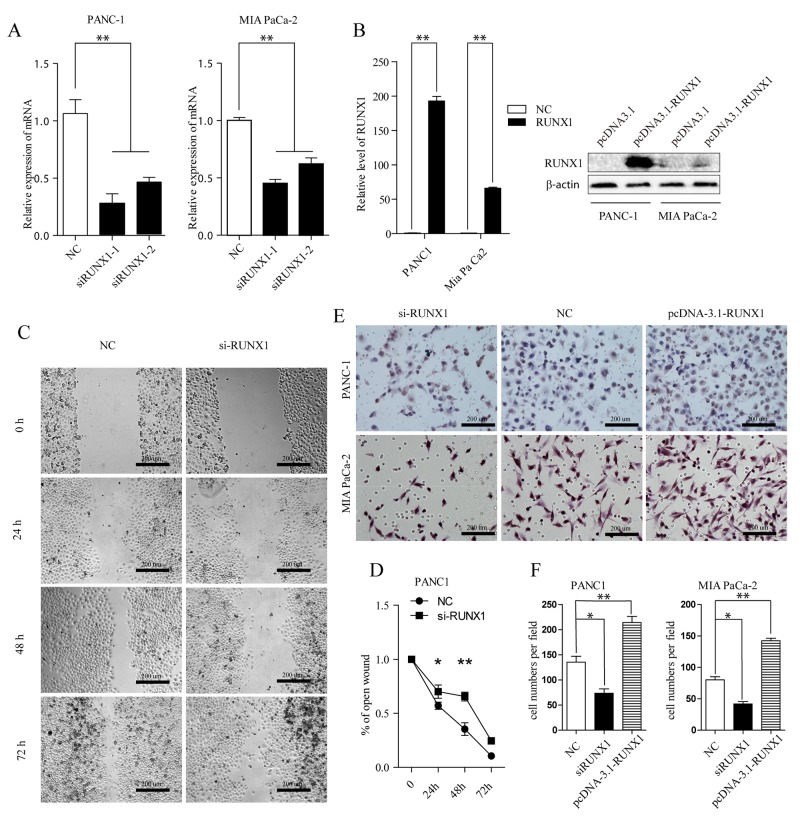
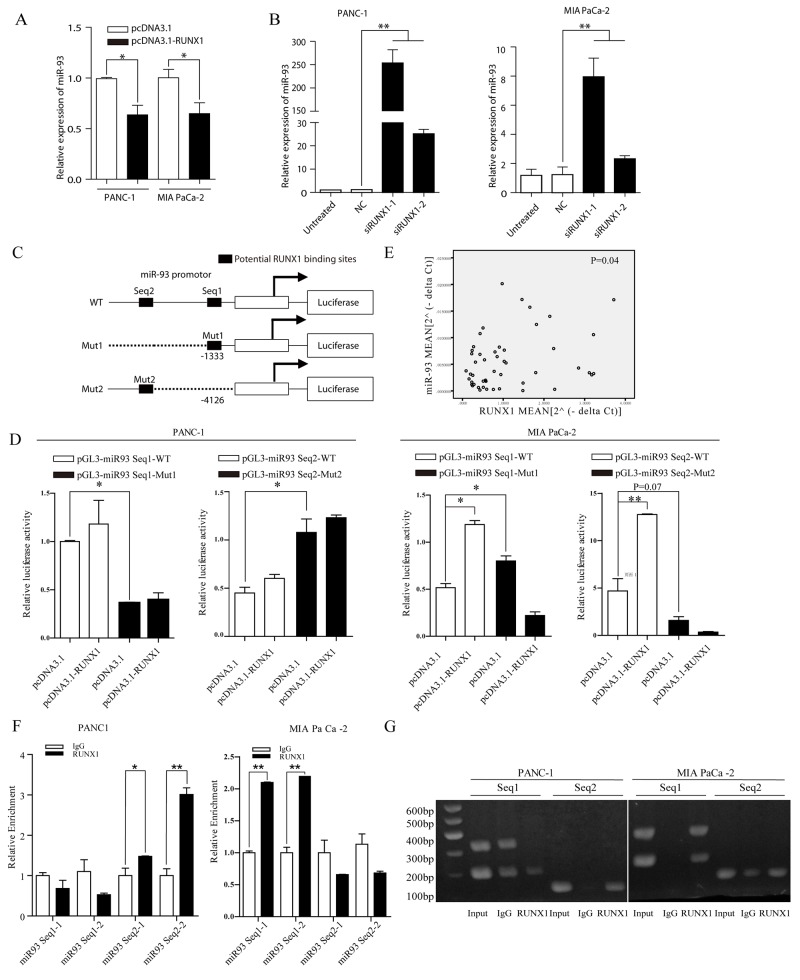
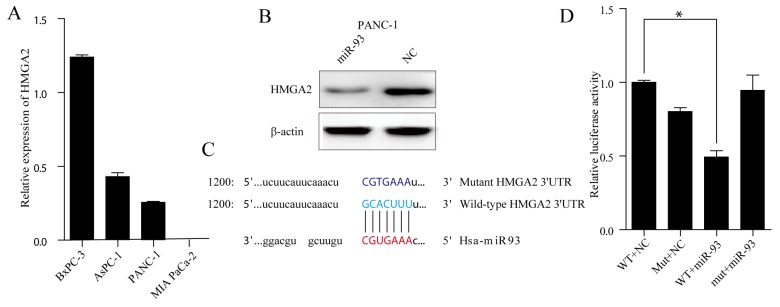
Runt-related transcription factor 1(RUNX1), a key factor in hematopoiesis that mediates specification and homeostasis of hematopoietic stem and progenitor cells (HSPCs), is also overexpressed in several solid human cancers, and correlated with tumor progression. However, the expression and function of RUNX1 in pancreatic ductal adenocarcinoma were still unclear. Here, we show that RUNX1 is highly expressed in pancreatic adenocarcinoma tissues and knocking down of RUNX1 attenuated aggressiveness in pancreatic cell lines. Moreover, we found that RUNX1 could negatively regulate the expression of miR-93. Bioinformatics method showed that there are two binding sites in the the promotor region of miR-93 precursor and through ChIP-qPCR and firefly luciferase reporter assay, we vertified that these two binding sites each have transcriptive activity in one pancreatic cell lines. This result supported our presumption that RUNX1 regulate miR-93 through binding to the promotor region of miR-93. Besides, the expression and function of miR-93 is quite the opposite, miR-93 overexpression suppresses migration and invasiveness in pancreatic cell lines supporting that RUNX1 negatively regulated miR-93. Our findings provided evidence regarding the role of RUNX1 as an oncogene through the inhibition of miR-93. Targeting RUNX1 can be a potential therapeutic strategy in pancreatic cancer.

Keywords: HMGA2 (High mobility group AT-hook 2); RUNX1; miR-93; pancreatic ductal adenocarcinoma (PDAC); tumor progression.


Conflict of interest statement

CONFLICTS OF INTEREST The authors declare no competing financial interests.

Figures

Figure 1
Figure 1
(A) Volcano plot showing relationship between magnitude of gene expression change (log2 of fold-change; y-axis) and statistical significance of this change [-log10 of adjusted p value; x-axis] in a comparison of tumors and adjacent non-tumor tissues in GSE71989 (left) and GSE28735 (right) cohorts. Red points represent differentially expressed genes (with cut-off FDR < 0.05) with magnitude of change ≥2. (B) Gene expression of RUNX1 in two independent cohorts of PDAC. RUNX1 is increased in tumors compared with non-tumor tissues in GSE71989 (left) and GSE28735 (right) cohorts. Box plots represent gene expression level with relative intensity (log2) of microarray data. Bars indicate median value. Student t test. (C) Average relative RUNX1 expression level in PDAC compared with that in normal tissues. Expression of RUNX1 was measured by qRT-PCR and normalized by GADPH. (D) Immunohistochemical staining for RUNX1 protein in normal pancreas and PDAC tissues, brown granule in nucleus showed low or high expressed RUNX1 with lower magnification images (5×, left) and its expanded views (20×, right). (E) Protein expression in 3 paired PDAC and the adjacent normal pancrea tissues. RUNX1 protein expression level was determined by immunoblotting with GADPH as a control. (F) Kaplan-Meier curves for OS in PDAC patients with RUNX1 expession. Gene expression of RUNX1 is divided into high and low expression groups using a median cutoff. Log-rank P value is indicated in the graphs.
Figure 2
Figure 2
(A) RUNX1 knocking down efficiency was measured by RT-qPCR assay in two cells (siRUNX1-1 and siRUNX1-2 are different siRNA fragments). ** P < 0.01. (B) Overexpression of RUNX1. Cells were transfected with pcDNA3.1-RUNX1 or empty vector pcDNA3.1. Overexpression of RUNX1 was confirmed by RT-qPCR (Left) and Western blotting (Right) in two cells, respectively. **P < 0.01, t test. (C, D) Wound healing assay. PANC-1 cell was transfected with Negative Control (NC) and si-RUNX1. Optical images of wounded cell monolayers were taken after 0 h, 24 h, 48 h, and 72h. The remaining distance was calculated as a percentage of the initial wound area. *P<0.05 or **P<0.01. (E, F) Two pancreatic cell lines transfected with NC, si-RUNX1 and pcDNA3.1-RUNX1 cells were collected and induced to invade through Matrigel-coated transwell membranes. The numbers of migrated cells were counted. ** P < 0.01.
Figure 3
Figure 3
(A) miR-93 expression decreased in pcDNA3. 1-RUNX1 transefected PANC-1 and MIA PaCa-2 cells, compared with pcDNA3.1 group. Data were normalized by U6. *P<0.05. (B) Relative miR-93 expression level measured by RT-qPCR. Two cells were separately transfected with NC and two RUNX1 siRNA (siRUNX1-1, siRUNX1-2). Results were normalized by U6. ** P < 0.01. (C) Schematic diagram of the pGL3 luciferase reporter constructs containing miR-93 precurser and upstream two potential RUNX1 binding sites (-1333 and -4126). The black boxes indicate the two predicted RUNX1 binding site in the promoter region of miR-93, respectively. The white box indicates miR-93 precurser. Seq1 and Seq2 refer to each sequence long enough to cover binding sites for primers use or sequence insert). (D) The luciferase reporter constructs of the truncated miR-93 promoters and corresponding mutates were introduced into PANC-1 and MIAPaCa-2 cells pretransfected with pcDNA3.1-RUNX1 or empty. Luciferase activity was measured 48 h post transfection. (E) Expression of miR-93 was positively correlated with that of RUNX1 (P=0.04) in clinical samples. (F) Fold-enrichment of RUNX1 binding at the miR-93 promoter relative to background in PANC-1 and MIA PaCa-2 cells was measured by RT-qPCR. Normalized to GAPDH, results were adjusted as n-fold compared to IgG. Data are presented as mean ± SEM. ** P<0.01. (G) Agarose gel analysis of ChIP-PCR products.
Figure 4
Figure 4
(A, B) Representative photos of wound healing assay of PANC-1 at 0 h, 24 h, and 48 h after wound scratch. The remaining distance was calculated as a percentage of the initial wound area. *P < 0.05. (C, D) Representative images of cells that migrated through transwell inserts with matrigel. Data are presented as means±SEM based on three independent experiments in triplicate. (E) E-cadherin, vimentin and N-cadherin expression in PANC-1 and MIA PaCa-2 cells after transfecting with NC or miR-93 mimic, respectively. Western blot analysis with β-actin as the internal control. (F) mRNA level of EMT markers in PANC-1 and MIA PaCa-2 cells after transfecting NC or miR-93 mimic, respectively. RT-qPCR analyses were presented, separately. Data were means ± SEM of triplicates. *P < 0.05, **P<0.01. NC, Negative control microRNA. (G) Snail, Slug, Zeb1 and β-catenin, K-ras expression after transfecting NC and miR-93 mimic was detected by western blot analysis with β-actin used as the internal control. (H) mRNA levels of EMT regulators (Snail, Slug, Zeb1, β-catenin) in PANC-1 cells after transfecting NC and miR-93 mimic. RT-qPCR analyses were presented as means ± SD of triplicates. *P< 0.05, **P<0.01.
Figure 5
Figure 5
(A) RT–qPCR analysis of HMGA2 expression in four PDAC cell lines (BxPC-3, AsPC-1, PANC-1 and MIA PaCa-2). Transcript levels were normalized to GAPDH expression. (B) Western blot analysis of HMGA2 level in PANC-1 cells after transfecting NC and miR-93 mimic Cell protein was harvested 48h posttransfection and used for western blot analysis. (C) The binding region between wild-type HMGA2 3’UTR (base sequence in pale bule) and candidate microRNA (has-miR-93) (base sequence in red), and the mutated sites of HMGA2 3’UTR (base sequence in navy blue). (D) PANC-1 cells were co-transfected with miR-93 mimic and with either Wild-Type or MUT HMGA2 3’UTR reporter vector. Luciferase activities were tested 48h after transfection.
Figure 6
Figure 6
(A) Immunohistochemical staining for HMGA2 protein in normal, well- and poorly differnetiated PDAC (HMGA2 antibody, hematoxylin counterstain) with lower magnification images (5×, left) and its expanded views (20×, right). (B, C) Wound healing assay. PANC-1 cell was transfected with Negative Control (NC) and si-HMGA2. Optical images of wounded cell monolayers were taken after 0 h, 24 h and 48h. The remaining distance was calculated as a percentage of the initial wound area. The data presented were mean ± SEM of three independent experiments performed separately; *P<0.05 or **P<0.01. (D, E) PANC1 cells transfected NC and si-HMGA2 cells were induced to invade through Matrigel-coated transwell membranes. The number of migrated cells was counted. ** P < 0.01.

References

    1. Siegel RL, Miller KD, Jemal A. Cancer statistics, 2016. CA Cancer J Clin. 2016;66:7–30. https://doi.org/10.3322/caac.21332. - DOI - PubMed
    1. Ferlay J, Steliarova-Foucher E, Lortet-Tieulent J, Rosso S, Coebergh JW, Comber H, Forman D, Bray F. Cancer incidence and mortality patterns in Europe: estimates for 40 countries in 2012. Eur J Cancer. 2013;49:1374–403. https://doi.org/10.1016/j.ejca.2012.12.027. - DOI - PubMed
    1. Chen X, Yang H, Zhou X, Zhang L, Lu X. MiR-93 Targeting EphA4 Promotes Neurite Outgrowth from Spinal Cord Neurons. J Mol Neurosci. 2016;58:517–24. https://doi.org/10.1007/s12031-015-0709-0. - DOI - PubMed
    1. Ryan DP, Hong TS, Bardeesy N. Pancreatic adenocarcinoma. N Engl J Med. 2014;371:1039–49. https://doi.org/10.1056/NEJMra1404198. - DOI - PubMed
    1. Kamisawa T, Wood LD, Itoi T, Takaori K. Pancreatic cancer. The Lancet. 388:73–85. https://doi.org/10.1016/S0140-6736(16)00141-0. - DOI - PubMed