

Origin and cross-century dynamics of an avian hybrid zone
- PMID: 29246108
- PMCID: PMC5732383
- DOI: 10.1186/s12862-017-1096-7
Origin and cross-century dynamics of an avian hybrid zone
Abstract
Background: Characterizations of the dynamics of hybrid zones in space and time can give insights about traits and processes important in population divergence and speciation. We characterized a hybrid zone between tanagers in the genus Ramphocelus (Aves, Thraupidae) located in southwestern Colombia. We evaluated whether this hybrid zone originated as a result of secondary contact or of primary differentiation, and described its dynamics across time using spatial analyses of molecular, morphological, and coloration data in combination with paleodistribution modeling.
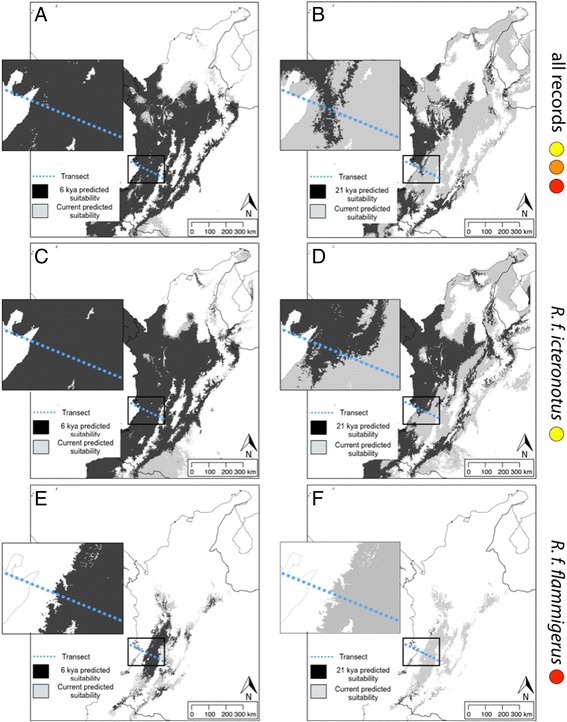
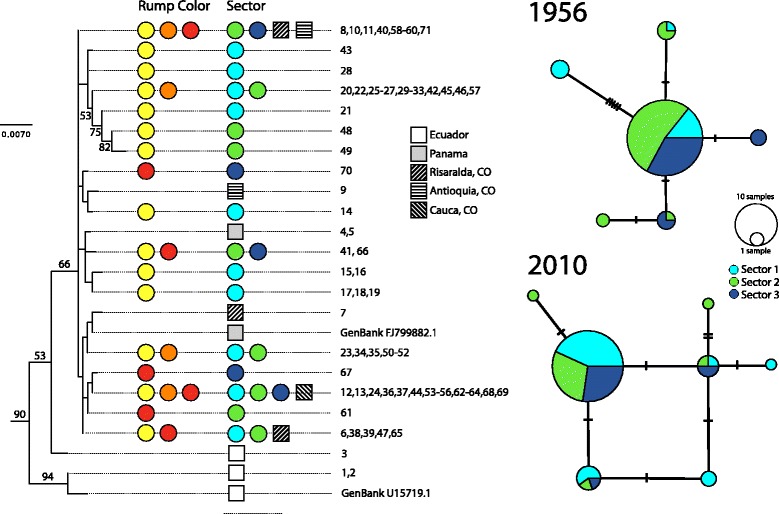
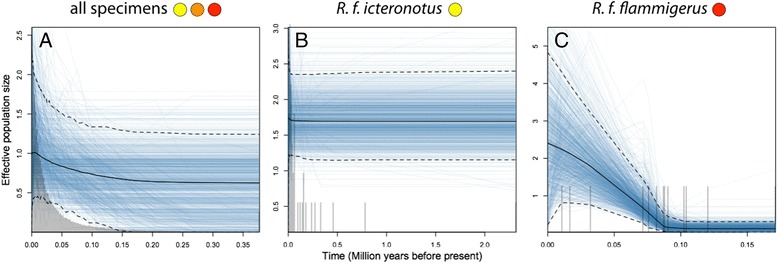
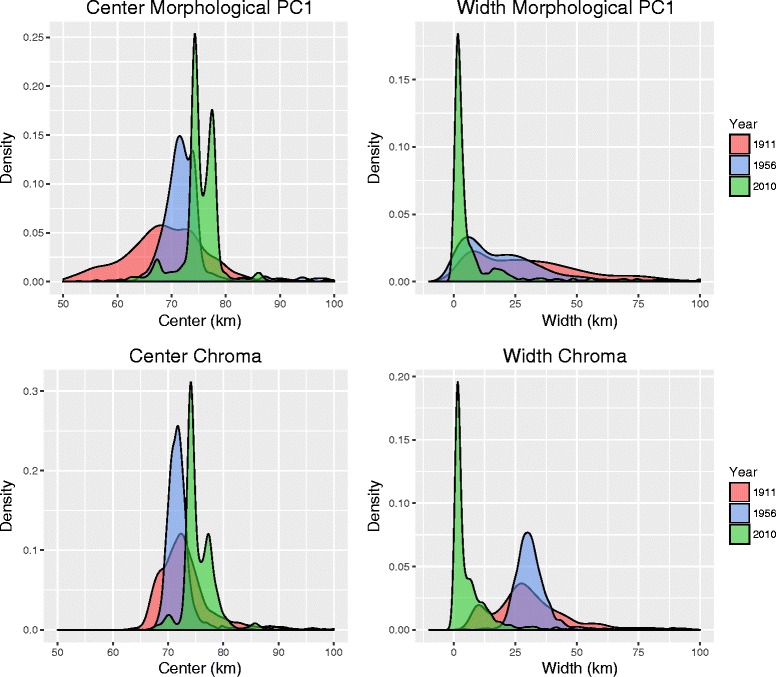
Results: Models of potential historical distributions based on climatic data and genetic signatures of demographic expansion suggested that the hybrid zone likely originated following secondary contact between populations that expanded their ranges out of isolated areas in the Quaternary. Concordant patterns of variation in phenotypic characters across the hybrid zone and its narrow extent are suggestive of a tension zone, maintained by a balance between dispersal and selection against hybrids. Estimates of phenotypic cline parameters obtained using specimens collected over nearly a century revealed that, in recent decades, the zone appears to have moved to the east and to higher elevations, and may have become narrower. Genetic variation was not clearly structured along the hybrid zone, but comparisons between historical and contemporary specimens suggested that temporal changes in its genetic makeup may also have occurred.
Conclusions: Our data suggest that the hybrid zone likey resulted from secondary contact between populations. The observed changes in the hybrid zone may be a result of sexual selection, asymmetric gene flow, or environmental change.
Keywords: Andes; Cline; Distribution modeling; Hill function; Hybridization; Moving hybrid zone.
Conflict of interest statement
Ethics approval and consent to participate
Procedures employed have been approved by the ethics committee at Universidad de los Andes.
Consent for publication
All authors read, commented on, and approved the submission of the manuscript to BMC Evolutionary Biology.
Competing interests
The authors declare that they have no competing interests.
Publisher’s Note
Springer Nature remains neutral with regard to jurisdictional claims in published maps and institutional affiliations.
Figures


Similar articles
-
Integrating phylogeography and paleoecology to investigate the origin and dynamics of hybrid zones: insights from two widespread North American firs.Mol Ecol. 2015 Jun;24(11):2856-70. doi: 10.1111/mec.13194. Epub 2015 May 14. Mol Ecol. 2015. PMID: 25865063
-
Cross-decades stability of an avian hybrid zone.J Evol Biol. 2019 Nov;32(11):1242-1251. doi: 10.1111/jeb.13524. Epub 2019 Oct 3. J Evol Biol. 2019. PMID: 31430391
-
Hybrid zone formation and contrasting outcomes of secondary contact over transects in common toads.Mol Ecol. 2017 Oct;26(20):5663-5675. doi: 10.1111/mec.14273. Epub 2017 Aug 24. Mol Ecol. 2017. PMID: 28752635
-
A Darwinian Laboratory of Multiple Contact Zones.Trends Ecol Evol. 2020 Nov;35(11):1021-1036. doi: 10.1016/j.tree.2020.07.015. Epub 2020 Sep 8. Trends Ecol Evol. 2020. PMID: 32912631 Review.
-
The Tangled Evolutionary Legacies of Range Expansion and Hybridization.Trends Ecol Evol. 2016 Sep;31(9):677-688. doi: 10.1016/j.tree.2016.06.010. Epub 2016 Jul 20. Trends Ecol Evol. 2016. PMID: 27450753 Review.
Cited by
-
Systematics of Thraupis (Aves, Passeriformes) reveals an extensive hybrid zone between T. episcopus (Blue-gray Tanager) and T. sayaca (Sayaca Tanager).PLoS One. 2022 Oct 5;17(10):e0270892. doi: 10.1371/journal.pone.0270892. eCollection 2022. PLoS One. 2022. PMID: 36197923 Free PMC article.
-
Microstructures amplify carotenoid plumage signals in tanagers.Sci Rep. 2021 Apr 21;11(1):8582. doi: 10.1038/s41598-021-88106-w. Sci Rep. 2021. PMID: 33883641 Free PMC article.
-
Primary hybrid zone formation in Tephroseris helenitis (Asteraceae), following postglacial range expansion along the central Northern Alps.Mol Ecol. 2021 Apr;30(7):1704-1720. doi: 10.1111/mec.15832. Epub 2021 Mar 16. Mol Ecol. 2021. PMID: 33548078 Free PMC article.
-
Trait Variation and Spatiotemporal Dynamics across Avian Secondary Contact Zones.Biology (Basel). 2024 Aug 22;13(8):643. doi: 10.3390/biology13080643. Biology (Basel). 2024. PMID: 39194581 Free PMC article. Review.
-
Temporal stability of the hybrid zone between Calocitta magpie-jays revealed through comparison of museum specimens and iNaturalist photos.Ecol Evol. 2023 Mar 15;13(3):e9863. doi: 10.1002/ece3.9863. eCollection 2023 Mar. Ecol Evol. 2023. PMID: 36937059 Free PMC article.
References
-
- Barton NH, Hewitt GM. Analysis of hybrid zones. Annu Rev Ecol Syst. 1985;16:113–148.
-
- Coyne JA, Orr HA. Speciation. Sunderland: Sinauer Associates; 2004.
-
- Durrett R, Buttel L, Harrison R. Spatial models for hybrid zones. Heredity. 2000;84:9–19. - PubMed
-
- Mayr E. Systematics and the origin of species, from the viewpoint of a zoologist. Cambridge: Harvard University Press; 1942.
-
- Harrison RG. Hybrid zones: windows on evolutionary process. In: Futuyma DJ, Antonovics J, editors. Oxford surveys in evolutionary biology. Oxford: Oxford University Press; 1990. pp. 69–128.
MeSH terms
Substances
LinkOut - more resources
Full Text Sources
Other Literature Sources
