. 2017 Dec 16;18(1):50.
doi: 10.1186/s12865-017-0235-7.

Helios + Regulatory T cell frequencies are correlated with control of viral replication and recovery of absolute CD4 T cells counts in early HIV-1 infection

Affiliations

Helios + Regulatory T cell frequencies are correlated with control of viral replication and recovery of absolute CD4 T cells counts in early HIV-1 infection

Raquel Matavele Chissumba et al. BMC Immunol. .

Abstract

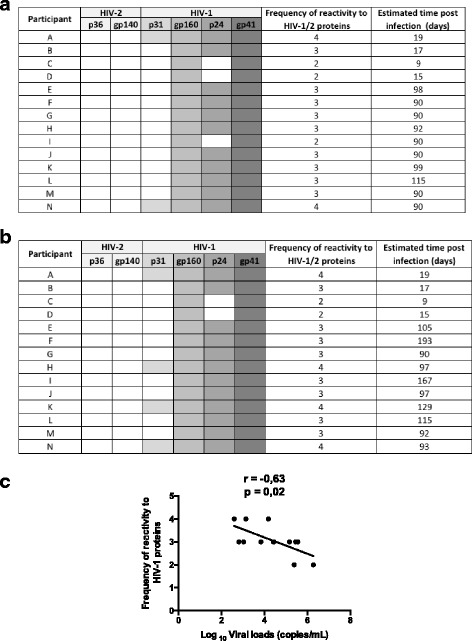
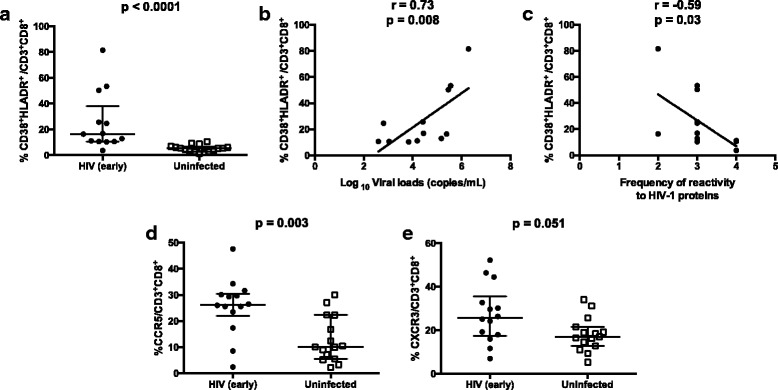
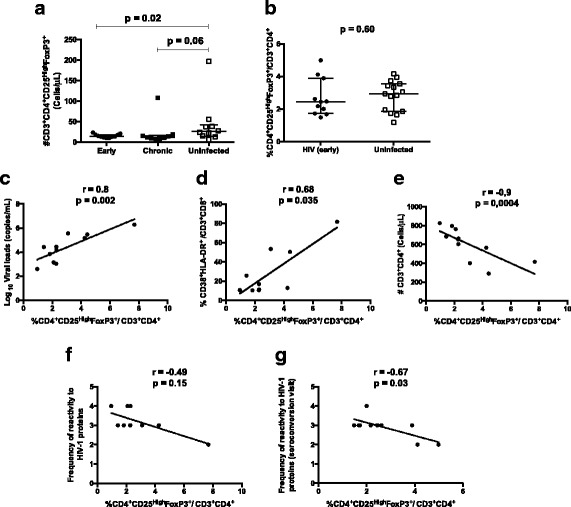
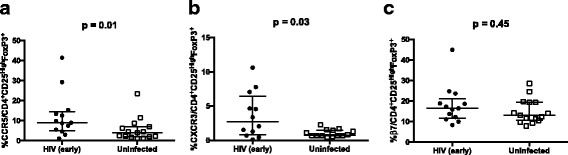
Background: The acute phase of HIV infection is characterized by massive depletion of CD4 T cells, high viral plasma levels and pronounced systemic immune activation. Regulatory T cells (Tregs) have the potential to control systemic immune activation but also to suppress antigen specific T and B cell response. The co-expression of FoxP3 and Helios transcription factors, has been described for identification of highly suppressive Tregs. The aim of this study was to characterize the phenotype of classic Tregs during early HIV infection, and to assess the correlations between the frequencies and phenotype of Tregs with the plasma viral load, CD4 counts, immune activation and the frequency of antibodies reactive to HIV-1 proteins, measured by an immunochromatographic test.

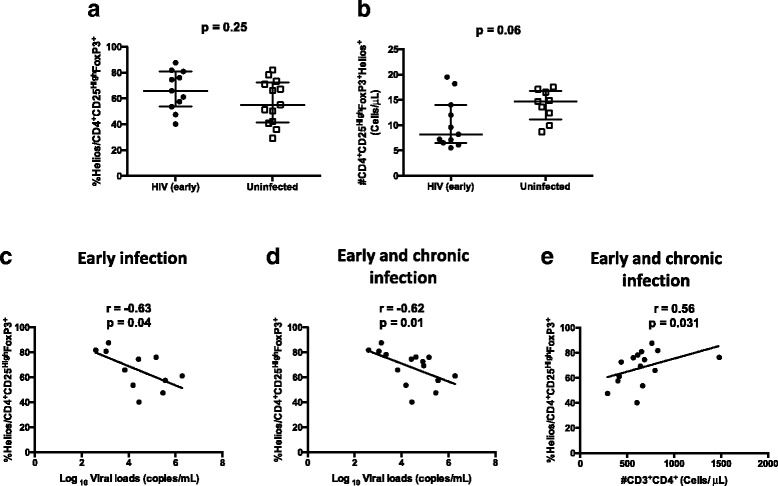
Results: The relative frequency of classic Tregs cells in peripheral blood correlated positively with HIV viral load and immune activation of CD8 T cells, and inversely with absolute CD4 counts and development of anti-HIV antibodies in subjects with early HIV infection. However, the expression of Helios in classic Tregs was inversely correlated with viral replication and immune activation, and positively with recovery of CD4 T cell counts and appearance of antibodies reactive to HIV-1 proteins.

Conclusion: These results raise the hypothesis that classic Tregs are inefficient at controlling systemic immune activation in subjects with early HIV infection and may be associated with delayed production of antibodies against HIV proteins, delaying the control of viral replication. Conversely, Helios expressing Tregs might contribute to control of viral replication by mechanisms involving the limitation of systemic immune activation.

Keywords: HIV early infection; Helios; Tregs.


Conflict of interest statement

Authors’ information

The views expressed are those of the authors and should not be construed to represent the positions of the Departments of the Army or Defense or the National Institutes of Health (NIH).

Ethics approval and consent to participate

The regulatory authorities in Mozambique, United States of America and Belgium, the Mozambican National Ethics Committee (Comité Nacional de Bioética em Saúde) (IRB00002657), the Walter Reed Army Institute of Research (WRAIR) Institutional Review Board (IRB00000794), and the Medical Ethics Committee of the Institute of Tropical Medicine (IRB/AB/ac/007), Antwerp, Belgium, respectively, approved this study. A written informed consent was obtained for every participant and all consented to participate in this study.

Consent for publication

Not applicable.

Competing interests

The authors declare that they have no competing interests.

Publisher’s Note

Springer Nature remains neutral with regard to jurisdictional claims in published maps and institutional affiliations.

Figures

Fig. 1
Fig. 1
Frequency of antibodies reactive to HIV-1 proteins in plasma from HIV early infected individuals. Serum samples from HIV infected individuals with early infection were collected for assessment of reactivity to HIV-1 proteins using the Geenius HIV-1/2 Confirmatory System. The reactivity of serum samples to HIV-1 proteins p31, gp160, p24 and gp 41 was recorded at seroconversion visit (a) and at time of PBMC collection (b). For each individual, the frequency of reactive bands on Geenius test, is indicated. c Correlation between the frequency of reactive bands and viral loads at PBMC collection visit
Fig. 2
Fig. 2
Proportions of CD8 T cells co-expressing the activation markers and chemokine receptors. PBMC from 15 HIV uninfected individuals and 14 individuals early infected by HIV-1, were isolated and manipulated as described in methods section. These PBMC, were stained with monoclonal antibodies and analyzed by polychromatic flow cytometry. Viral loads and frequency of antibodies reactive to HIV-1 proteins was determined using plasma samples and serum, respectively, as described on methods section. a Median and interquartile range of proportions of CD8 T cells co-expressing the activation markers CD38 and HLA-DR between uninfected and HIV early infected groups. Each point represents an individual. Unpaired Mann-Whitney test p-values, comparing medians from HIV uninfected group and individuals with HIV early infection, are indicated on each figure. b-c Correlation analysis between the immune activation of CD8 T cells with the viral loads and frequency of antibodies reactive to HIV-1 proteins in HIV-1 early infected subjects. Spearman correlation r and p-values are indicated on each figure. d-e Median and IQR of proportions of CD8 T cells expressing the chemokine receptors, CCR5 and CXCR4. Each point represents an individual. Unpaired Mann-Whitney test p-values, comparing medians from HIV uninfected group and individuals with HIV early infection, are indicated on each figure
Fig. 3
Fig. 3
Frequencies of Tregs and correlations with virologic and immunologic indicators. PBMC from HIV uninfected controls (15), HIV recently (11) and chronically (eight) infected patients, were isolated and manipulated as described in methods section. These PBMC were stained with monoclonal antibodies and analyzed by polychromatic flow cytometry. Viral loads and frequency of antibodies reactive to HIV-1 proteins were determined using plasma and serum samples, respectively, as described on methods section. a-b Median and interquartile range for proportions and absolute counts of classic Tregs, CD4+CD25HighFoxP3, in study groups. Each point represents an individual. Unpaired Mann-Whitney test p-values comparing medians from controls and HIV infected groups are indicated on each figure. c-g Correlations between the proportions of classic CD4+CD25HighFoxP3+ Tregs with the viral loads, immune activation, absolute CD4 T cell counts and frequency of antibodies reactive to HIV-1 proteins at time of PBMC collections and at seroconversion visit. Each point corresponds to one individual. Spearman correlation r and p-values are indicated on each figure
Fig. 4
Fig. 4
Expression of chemokine receptors CCR5 and CXCR3, and β7 integrin in classic Tregs. PBMC from 15 HIV uninfected individuals and 11 HIV-1 early infected individuals, were isolated and manipulated as described in methods section. These PBMC were stained with the following combination of monoclonal antibodies: CD195FITC/ FoxP3PE/ CD49dPerCP/ CD25PE-CY7/ β7APC/ CD3APC-H7/ CD4V450/ FVS510. Data acquisition was performed on a flow cytometer (FACS CANTO II). Viral loads and frequency antibodies reactive to HIV-1 proteins was determined using plasma samples as described on methods section. a-c Median and interquartile range for proportions of CCR5, CXCR3 and β7 expression on classic CD4+CD25HighFoxP3+ Tregs, in study groups. Each point represents an individual. Unpaired Mann-Whitney test p-values comparing medians from HIV uninfected controls and HIV infected group are indicated on each figure. Each point corresponds to one individual. p-values are indicated on each figure
Fig. 5
Fig. 5
Frequencies of Helios expressing Tregs and correlation with virologic and immunologic indicators. PBMC from HIV uninfected controls (15), HIV recently (11) and chronically (eight) infected patients, were isolated and manipulated as described in methods section. These PBMC were stained with the following combination of monoclonal antibodies: CD31FITC/ FoxP3PE/ CD45RAPerCP/ CD25PE-CY7/ HeliosAPC/ CD3APC-H7/ CD4V450/ FVS510. Data acquisition was performed on a flow cytometer (FACS CANTO II). Viral loads and frequency of antibodies reactive to HIV-1 proteins was determined using plasma samples as described on methods section. Absolute frequency of CD4 T cells was determined using a four-color flow cytometer (FACS Calibur), and the TruCount method, as described previously described [24]. a-b Median and interquartile range for proportions and absolute counts of CD4+CD25HighFoxP3+Helios+ Tregs in study groups. Each point represents an individual. Unpaired Mann-Whitney test p-values comparing medians from controls and HIV infected group are indicated on each figure. c Correlation between the frequency of Helios expressing Tregs in early infected subjects with the viral loads. d-e Correlation between the frequency of Helios expressing Tregs in early and chronically infected subjects with the viral loads and absolute CD4 T cell counts. Each point corresponds to one individual. Spearman correlation r and p-values are indicated on each figure

References

    1. Sakaguchi S, et al. Regulatory T cells and immune tolerance. Cell. 2008;133(5):775–787. doi: 10.1016/j.cell.2008.05.009. - DOI - PubMed
    1. Hartigan-O'Connor DJ, et al. Human CD4+ regulatory T cells express lower levels of the IL-7 receptor alpha chain (CD127), allowing consistent identification and sorting of live cells. J Immunol Methods. 2007;319(1–2):41–52. doi: 10.1016/j.jim.2006.10.008. - DOI - PubMed
    1. Nishimura E, et al. Induction of antigen-specific immunologic tolerance by in vivo and in vitro antigen-specific expansion of naturally arising Foxp3+CD25+CD4+ regulatory T cells. Int Immunol. 2004;16(8):1189–1201. doi: 10.1093/intimm/dxh122. - DOI - PubMed
    1. Zheng SG, et al. Natural and induced CD4+CD25+ cells educate CD4+CD25- cells to develop suppressive activity: the role of IL-2, TGF-beta, and IL-10. J Immunol. 2004;172(9):5213–5221. doi: 10.4049/jimmunol.172.9.5213. - DOI - PubMed
    1. Sugimoto N, et al. Foxp3-dependent and -independent molecules specific for CD25+CD4+ natural regulatory T cells revealed by DNA microarray analysis. Int Immunol. 2006;18(8):1197–1209. doi: 10.1093/intimm/dxl060. - DOI - PubMed

MeSH terms

Substances