. 2017 Dec 19;47(6):1169-1181.e7.
doi: 10.1016/j.immuni.2017.11.010. Epub 2017 Dec 12.

Cystic Fibrosis Transmembrane Conductance Regulator Attaches Tumor Suppressor PTEN to the Membrane and Promotes Anti Pseudomonas aeruginosa Immunity

Affiliations

Cystic Fibrosis Transmembrane Conductance Regulator Attaches Tumor Suppressor PTEN to the Membrane and Promotes Anti Pseudomonas aeruginosa Immunity

Sebastián A Riquelme et al. Immunity. .

Abstract

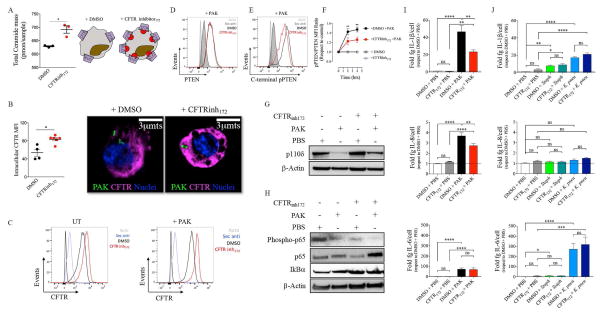
The tumor suppressor PTEN controls cell proliferation by regulating phosphatidylinositol-3-kinase (PI3K) activity, but the participation of PTEN in host defense against bacterial infection is less well understood. Anti-inflammatory PI3K-Akt signaling is suppressed in patients with cystic fibrosis (CF), a disease characterized by hyper-inflammatory responses to airway infection. We found that Ptenl-/- mice, which lack the NH2-amino terminal splice variant of PTEN, were unable to eradicate Pseudomonas aeruginosa from the airways and could not generate sufficient anti-inflammatory PI3K activity, similar to what is observed in CF. PTEN and the CF transmembrane conductance regulator (CFTR) interacted directly and this interaction was necessary to position PTEN at the membrane. CF patients under corrector-potentiator therapy, which enhances CFTR transport to the membrane, have increased PTEN amounts. These findings suggest that improved CFTR trafficking could enhance P. aeruginosa clearance from the CF airway by activating PTEN-mediated anti-bacterial responses and might represent a therapeutic strategy.

Keywords: CFTR; NF-κB; PI3K; PTEN; Pseudomonas aeruginosa.


Conflict of interest statement

CONFLICT OF INTEREST: Authors declare no conflicts of interest.

Figures

Figure 1
Figure 1. PTEN, PI3K p110 and TIRAP are dynamically regulated in response to infection
(A–D) Intracellular MFI of PTEN, TIRAP and class I PI3K catalytic subunits p110δ and p110γ were measured by flow cytometry in BMDMs at 6h post PBS or P. aeruginosa (PAK) treatment. (E–F) Immunoblots for two representative mice per group showing the role of PTEN-L in the protein amounts of TIRAP (Mal) and p110δ in response to PAK pulmonary infection. (G) Role of PTEN-L in the production of NF-κB-dependent cytokines during PAK infection. (H) Role of PTEN-L in lung pathology after PAK infection. White bar represents 60μmts. For A–D and G, t- Student test was used *, p<0.05; **, p<0.01; ****, p<0.0001; ns: non-significant. In vivo data represents two independent experiments with a total of 3-to-7 animals per group as average ± SEM. A–D represent 4 independent experiments as average ± SEM. See also Figure S1 and Figure S2.
Figure 2
Figure 2. CFTR mutations regulate abundance of PTEN, p110, phospho-Akt and TIRAP
(A) WT/WT- or ΔF508/W1282X CFTR cells were treated either with PBS or PAK for 3h. At different time points, frequencies of cells harboring intracellular both p110δ and p110γ were measured by flow cytometry (% of p110δ+p110γ+ cells). (B) Cells were treated as in A and phosphorylated Akt (phospho-Akt) was measured by intracellular flow cytometry. (C) WT/WT- or ΔF508/W1282X CFTR cells were treated as in A and 0, 7 or 22h post gentamicin treatment supernatants were collected, living cells counted and a ratio between total cytokine mass and viable cells was plotted. (D) Human monocytes (gated from PBMCs) from healthy controls and CF patients carrying CFTR mutations that affected CFTR protein generation (Type I and V mutation, see table) were analyzed for CFTR and PTEN by flow cytometry. (E–F) CFTR and PTEN MFI levels were quantified from D. (G) Western blot of PBMCs from HP (N=3) or CF (N=4) patients. PTEN, p110δ, phospho-Akt, TIRAP, CFTR and β-Actin were probed. (H–I) ΔF508 CFTR human epithelial cells (CFBE) were transfected either with a WT CFTR-expressing lentivirus (rescued cells, WT CFTR) or an empty vector (ΔF508 CFTR). Total intracellular CFTR MFI was measured by FACS. (J–K) Cells were treated as in H and intracellular PTEN MFI was measured by FACS. For H and J, red and gray lined histograms represent auto-fluorescence and secondary antibody background, respectively. (L) WT CFTR- rescued and non-rescued cells were lysed and Western Blot was performed for both CFTR, the regulatory subunit of PI3K (phosphorylated p85-p55), phospho-Akt and β-actin. (M–N) Rescued or not-rescued cells were lysed and Western Blot was performed for both PTEN and phospho-PTENC-term (Ser380-Thr382-Thr383). (O–P) Rescued or not-rescued cells were left untreated (O) or infected with P. aeruginosa (P) and intracellular FACS performed against phospho-PTENC-term (Ser380-Thr382-Thr383) and total PTEN. A phospho-PTEN to PTEN MFI ratio was plotted. (Q) Confocal microscopy showing membrane fluorescence of PTEN after CFTR rescue. Fluorescence intensity diagrams show PTEN expression pattern between the nuclei border and the cell membrane. White bar represents 5μmts. All graphs represent an average ± SEM between 3 (A, C, O, P) to 4 (I, K) independent experiments. For A and C, Two-Ways ANOVA was performed. For E, F, I, K, O and P, data were analyzed by t-Student test. *, p<0.05; **, p<0.01; ***, p<0.001; ****, p<0.0001; ns: non-significant. See also Figure S3 and Figure S4.
Figure 3
Figure 3. CFTR correction-potentiation increases both CFTR and PTEN amounts
(A) Human monocytes (from PBMC) from either healthy controls or CF patients carrying different CFTR mutations that affected either de novo CFTR protein generation (type I or V mutations) or post-translational CFTR protein folding-function (type II or III mutations) were analyzed for both CFTR and PTEN by flow cytometry. Where indicated, patients were under the treatment with different CFTR correctors-potentiators to correct both folding, transport to the membrane and activity, such as Lumacaftor, Ivacaftor, Orkambi, Vx-611, Vx-66, Vx-110, Ataluren. Distinct mutations graphed are shown in the right panel. (B) Representative matched dot-plots for healthy controls and CF patients harboring either a type II–III or type I–V mutations under or not treatment. (C–D) Intracellular CFTR and PTEN MFI quantification from flow cytometry data obtained for monocytes. For C and D, data were analyzed by One-Way ANOVA. ****, p<0.0001; ns: non-significant.
Figure 4
Figure 4. The human CFTRC-terminus interacts with PTEN
(A) Frontal and Lateral (left) view of the crystallized non-phosphorylated human CFTR and PTEN. PTEN PDB that represents crystalized PTEN does not show the PTEN C-terminus (PTEN14-351), which has been demonstrated as a negative regulator for its interaction with the membrane. Different CFTR domains are shown in different colors (MSD1-2: membrane-spanning domain; NBD1-2: nucleotide-binding domain 1–2; R: regulatory domain). CFTRC-term tail (CFTR1381-1440) is shown in red at the end of NBD2 (red arrow). PTEN (gray) and CFTR-NBD2 PDB structures where submitted to ClusProV2 clustering and modelling. (B) Model 1 (out of 4, see Figure S5A) from ClusProV2 protein-protein interaction modelling showing the interaction between PTEN14-351 and CFTR-NBD2 (CFTR1207-1440). The whole human CFTR structure complexed with human PTEN is showed to better display the orientation of PTEN from the cytoplasm. (C) Human crystallized CFTR-NBD2 and PTEN interaction model 1 from ClusProV2. CFTR1207-1380 is shown in purple. CFTR1381-1440 is shown in red. PTEN is shown in gray. Amino acids from CFTR1207-1440 taking contact with PTEN are displayed in cyan. PTEN amino acids contacting CFTR1207-1440 are shown in orange. (D) I-TASSER modelled CFTR1381-1480 and PTEN interaction model from ClusProV2. CFTR1381-1440 is shown in red. CFTR1441-1480 is shown in green. PTEN is shown in gray. Amino acids from CFTR1381-1480 taking contact with PTEN are displayed in cyan. PTEN amino acids contacting CFTR1381-1480 are shown in orange. (E) ELISA plates were coated either with rGST alone or rGST-CFTR1381-1480. Wells were blocked, washed and incubated with PTEN-containing human 16HBE cell lysates. Plates were revealed for PTEN. (F) ELISA plates were coated either with Vehicle or rPTEN lacking the C-terminus (PTEN1-351). Wells were blocked, washed and incubated with CFTR-containing human 16HBE cell lysates. Plates were revealed for CFTR. (G) CFTR-PTEN and CFTRCterm-PTEN proximity ligation assays (PLA) in human epithelial cells (16HBE). Intracellular detection of CFTR was performed by using either an antibody against a naturally extracellular-exposed loop of CFTR (anti-CFTR) or the CFTRC-term (anti-CFTRC-term). Control cells did not receive primary antibodies. Zoom insets show protein-protein interaction clusters. (H) Quantification of the amount of CFTR-PTEN or CFTRC-term-PTEN clusters obtained with PLA. (I) Pull down analyses between either recombinant CFTRC-term (rGST-CFTR1381-1480) or rGST with rPTEN lacking the C-terminus (PTEN1-351). PTEN was N-terminus tagged with a His-Tag. Anti-GST and anti-His were used to detect both GST-CFTR1381-1480, GST and His-rPTEN, respectively. (J) Human PBMCs from both WT (CFTR1- 1480) and W1282X mutants CF patients (CFTR1-1281) which lack CFTRC-term were stained for PTEN and analyzed by flow cytometry. (K) Human monocytes were exposed to GFP-expressing P. aeruginosa (PAK, shown as cyan in this picture) (MOI=10) and stained for CFTR (green), PTEN (red) and nuclei (blue). Where indicated, R1, R2 and R3 are region of interest (ROI) zoomed at the right part of the main figure. Colocalization between CFTR and PTEN can be seen as yellow color in insets. Only one confocal plane is shown. Data was analyzed by using FIJI. White bar represents 3μmts. Image represents 2 independent experiments. K represent 4 and E, F and H represent 3 independent experiments, respectively. Data is presented as average ± SEM. E–F were analyzed by Two-Ways ANOVA. H was analyzed by one-way ANOVA. For J, data were analyzed by t-Student test. *, p<0.05; ***, p<0.001; ****, p<0.0001; ns: non-significant. See also Figure S5.
Figure 5
Figure 5. CFTR amount but not channel activity promotes PTEN anti-inflammatory activity
(A) Human monocytes were treated for 24h either with CFTRinh172 (red figure in contact with CFTR structure, right of the graph) or DMSO (vehicle). Equals cells numbers were harvested and total ceramide content was analyzed by Mass Spectrometry. (B) Cells were treated as in A and infected for 1h with GFP-PAK (MOI=10). Cells were stained for CFTR (magenta) and nuclei (blue). White scale bar represents 3μmts. (C) After 24h of either DMSO or CFTRinh172 treatment cells were pulsed either with PBS (UT) or with PAK at MOI=10 for 3h. Intracellular staining for CFTR was performed. (D–E) At 3h post PAK infection, THP-1 cells were intracellularly stained for PTEN and phospho-PTEN (Ser380-The382-The383). (F) Kinetics post infection for the pPTEN to PTEN MFI ratio for cells treated or not with the CFTRinh172. (G) THP-1 cells were treated or not for 24h with CFTRinh172. Cells were infected or not with PAK at MOI=10 for 1h, washed and gentamicin-protected for an additional hour. Total proteins were extracted from cells with RIPA and blotted for p110δ and actin. (H) Cells were treated as in G, lysed 3h after gentamicin was added and blotted for the NF-κB p65 subunit, its activated-phosphorylated form, its negative regulator IκBα and actin. (I) NF-κB-dependent inflammatory cytokine secretion at different time points after PAK infection in cells treated either with DMSO or CFTRinh172. (J) Cells were treated as in F and infected either with Staphyloccocus aureus (MRSA) or Klebsiella pneumoniae (KPPR1) for 1h, MOI=10. Supernatants were collected and analyzed after incubation ON. B, C, D–F represent 4 and A, G–J represent 3 independent experiments, respectively. Data is presented as average ± SEM. For A and B, t-Student test was performed. For F and I, Two and for J One Way ANOVAs were performed. *: p<0.05; **: p<0,001; ****: p<0,0001; ns: non-significant.
Figure 6
Figure 6. CFTR-PTEN interaction promotes PTEN-mediated P. aeruginosa killing
(A) Data collected from the www.cftr2.org data base. Percentage of CF patients positive for P. aeruginosa sputum culture and their different CFTR genotypes. Type IV mutation: High amounts of non-functional CFTR at the membrane Type I-II-III- V mutations: Reduced CFTR amounts in the membrane. Right diagram shows an array of genotyped analyzed. (B) PBMCs from healthy controls (WT/WT CFTR) or CF patients harboring either Type II/III or Type I/V CFTR mutations were infected with PAK for 1h, washed and incubated with gentamicin during 16h. Intracellular bacteria were counted and standardized against total number of living cells. When indicated, the PTEN phosphatase activity inhibitor bpv(HOpic) was added with the gentamicin. (C) BMDMs from either WT/WT or ΔF508/ΔF508 Cftr were infected for 1h with PAK, washed, incubated with medium containing gentamicin and plated on LB agar at different time points. When indicated bpv(HOpic) was added. Intracellular CFU were counted and standardized against the total number of living cells. T=2h for WT/WT Cftr infected cells was used as the reference parameter (horizontal dotted line). (D) BMDMs from either Ptenl+/+ and Ptenl−/− were infected and processed as in C. (E) Ptenl+/+ and Ptenl−/− mice were intranasally infected with PAK and 16h later bacterial loads in both lungs and BAL were analyzed. (F) Human monocytes (THP-1 cells) were treated for 24h with the CFTRinh172 and challenged for 1h with PAK. At different time points cells were washed, recovered and plated on LB agar. Intracellular CFU were counted and standardized against the total number of living cells. T=2h for DMSO-treated cells was used as the reference parameter (horizontal dotted line). (G) Cells were treated as in F and after washing and gentamicin treatment, bpv(HOpic) was added at different concentrations. At 6h post infection, cells were washed, detached and plated and recovered CFU were counted. Number of CFU was standardized against total number of living cells. (H) Effects of bpv(HOpic) on PAK proliferation. B represents 5 and C–D, F–H represent 3 independent experiments each, respectively. E represents two independent experiments (7 mice in total per group). Data is presented as average ± SEM. For C, D, F and G Two-Ways ANOVA was used. For E, t-Student was employed. *, p<0.05; **, p<0.005; ***, p<0.001; ****, p<0.0001.

Comment in

References

    1. Akira S, Takeda K. Toll-like receptor signalling. Nat Rev Immunol. 2004;4:499–511. - PubMed
    1. Aksoy E, Taboubi S, Torres D, Delbauve S, Hachani A, Whitehead MA, Pearce WP, Berenjeno IM, Nock G, Filloux A, et al. The p110delta isoform of the kinase PI(3)K controls the subcellular compartmentalization of TLR4 signaling and protects from endotoxic shock. Nat Immunol. 2012;13:1045–1054. - PMC - PubMed
    1. Bae YS, Lee HY, Jung YS, Lee M, Suh PG. Phospholipase Cgamma in Toll-like receptor-mediated inflammation and innate immunity. Adv Biol Regul. 2017;63:92–97. - PubMed
    1. Bonfield TL, Hodges CA, Cotton CU, Drumm ML. Absence of the cystic fibrosis transmembrane regulator (Cftr) from myeloid-derived cells slows resolution of inflammation and infection. J Leukoc Biol. 2012;92:1111–1122. - PMC - PubMed
    1. Boyle MP, Bell SC, Konstan MW, McColley SA, Rowe SM, Rietschel E, Huang X, Waltz D, Patel NR, Rodman D, et al. A CFTR corrector (lumacaftor) and a CFTR potentiator (ivacaftor) for treatment of patients with cystic fibrosis who have a phe508del CFTR mutation: a phase 2 randomised controlled trial. Lancet Respir Med. 2014;2:527–538. - PubMed

MeSH terms