. 2017 Dec 15;2(18):eaao1314.
doi: 10.1126/sciimmunol.aao1314.

Microbial antigen encounter during a preweaning interval is critical for tolerance to gut bacteria

Affiliations

Microbial antigen encounter during a preweaning interval is critical for tolerance to gut bacteria

Kathryn A Knoop et al. Sci Immunol. .

Abstract

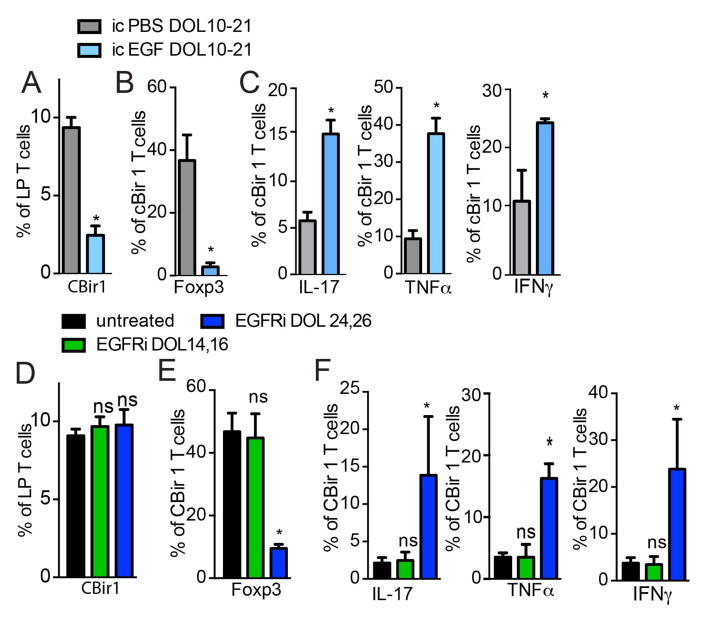
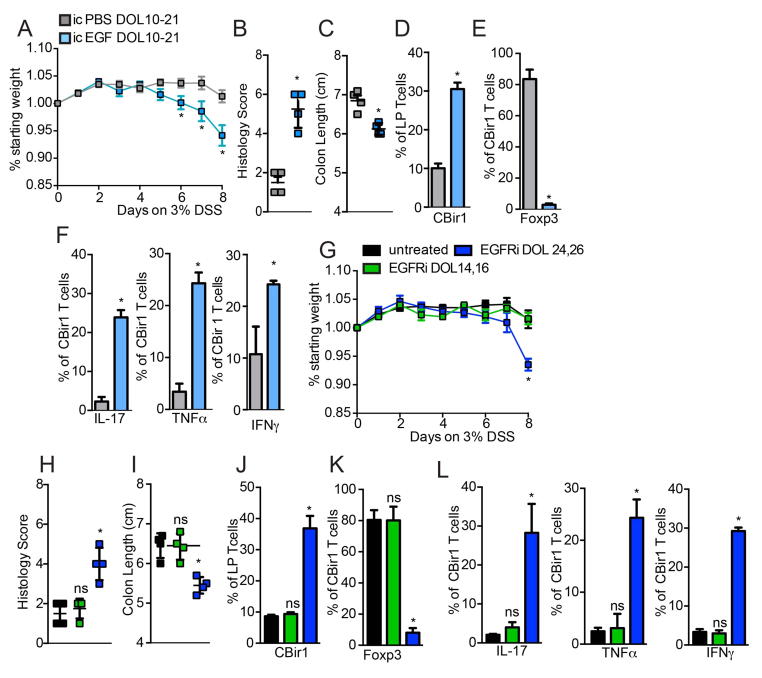
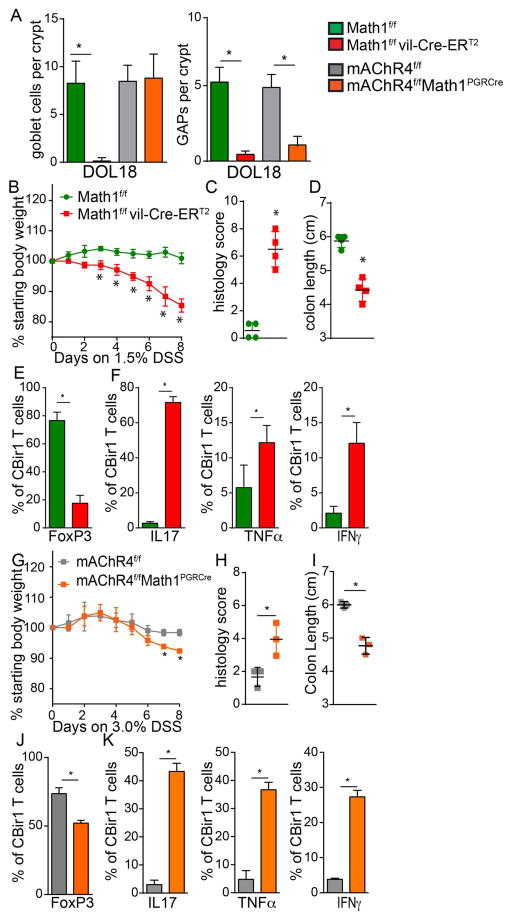
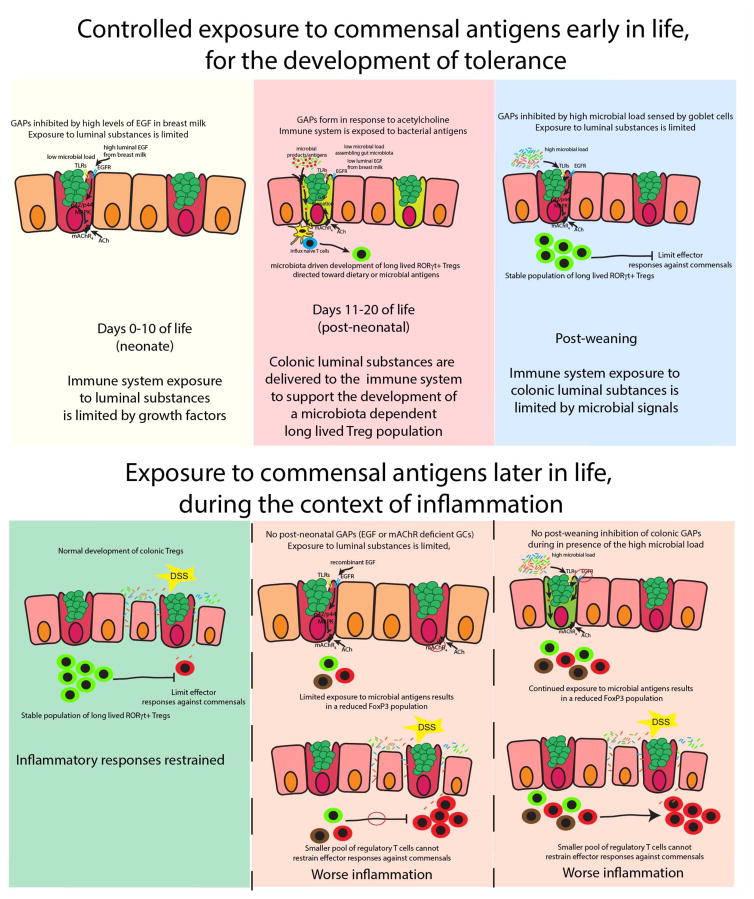
We have a mutually beneficial relationship with the trillions of microorganisms inhabiting our gastrointestinal tract. However, maintaining this relationship requires recognizing these organisms as affable and restraining inflammatory responses to these organisms when encountered in hostile settings. How and when the immune system develops tolerance to our gut microbial members is not well understood. We identify a specific preweaning interval in which gut microbial antigens are encountered by the immune system to induce antigen-specific tolerance to gut bacteria. For some bacterial taxa, physiologic encounters with the immune system are restricted to this interval, despite abundance of these taxa in the gut lumen at later times outside this interval. Antigen-specific tolerance to gut bacteria induced during this preweaning interval is stable and maintained even if these taxa are encountered later in life in an inflammatory setting. However, inhibiting microbial antigen encounter during this interval or extending these encounters beyond the normal interval results in a failure to induce tolerance and robust antigen-specific effector responses to gut bacteria upon reencounter in an inflammatory setting. Thus, we have identified a defined preweaning interval critical for developing tolerance to gut bacteria and maintaining the mutually beneficial relationship with our gut microbiota.


Conflict of interest statement

Competing interests: The authors declare no competing interests.

Figures

Figure 1
Figure 1. Bacterial antigen encounter occurs during a specific pre-weaning interval, is dependent upon GCs, and correlates with the presence of colonic GAPs
A) Fold increase in CBir1 T cells after ex vivo culture with LP-MNPs isolated from the SI or colon on DOL7, 14, 21, or 28. B) Percent of (CD45.1+) CBir1 T cells of total CD4+ T cells or C) percent of proliferating CBir1 T cells of the total CD45.1+ CBir1 T cells within the SI or colon draining MLNs three days following transfer into recipient CD45.2 mice on DOL 7,17, or 27. D) Percent of (CD45.1+) DP1 T cells of CD4+ T cells within the MLNs three days following transfer. E) Percent of CD45.1 cells of the total CD4+CD3+ T cell population or F) percentage of Foxp3+ cells of the CD45.1+ cells in the colon LP seven days following transfer of CD45.1+ CBir1, DP1 or OTII T cells into recipient mice not receiving ovalbumin; DOL represents day of transfer. G) Percentage of LP-MPNs staining for luminally administered Ova-647 on DOL7, 14, 21, or 28. H) 4kD FITC dextran in serum following gavage in DOL18 GC knockout and littermate control mice. I) Percentage of LP-MNPs staining for luminally administered Ova-647 in DOL18 GC knockout and littermate control mice J) Percent of CD45.1+ CBir1 cells of CD4+ T cells within the MLNs three days following transfer into DOL18 GC knockout and littermate control mice. M) Ratio of GAPs per GC in the SI and colon from DOL7-60. *= p<0.001, ns = not significant, n = 4 mice per group. Experiments in B, C, G, H, and K were repeated two independent times.
Figure 2
Figure 2. The microbiota inhibits colonic GAPs and antigen delivery post-weaning
A) Expression of TLRs 1–9 (labeled by the number), Myd88 (M), and EGFR (E) on FACS-sorted GCs from the SI (blue) or colon (red) of DOL18 mice. B) Ratio of GAPs per GCs in the colon of DOL18 specific pathogen free (SPF) housed mice, germ-free (GF) housed mice, SPF housed Myd88−/− mice or SPF housed mice lacking Myd88 in GCs, with or without luminal heat-killed cecal contents from a DOL56 SPF housed mice. C) Ratio of GAPs per GC in the colon of DOL18 mice following luminal LPS with or without inhibition of EGFR (EGFRi) or p42/p44 MAPK (MAPKi) activation. D) Quantification of 16s rRNA in the cecal contents from DOL7-60 E) Number of 16s rRNA sequences grouped by bacteria class across the first 28 days of life. Ratio of GAPs per GC in the F) SI and G) colon of Myd88f/fMath1PGRCre mice lacking Myd88 in GCs, or cre negative littermates on DOL8, 18, or 28. nd = not detected, * = p<0.05, ns = not significant, n = 4 mice per group. Experiments in A were repeated three independent times, B, C, F, and G were repeated two independent times.
Figure 3
Figure 3. EGFR activation in GCs inhibits GAP formation and luminal antigen delivery throughout life
A) GAPs per crypt or villius cross section in the SI (blue) or colon (red) of SPF housed mice in the presence of tropicamide (t), or carbamycholine (CCh) treatment on DOL8, 18, or 28. B) Immunofluorescent staining of phosphorylated EGFR (red; pEGFR) and cytokeratin 18 (green; CK18) in colon sections from DOL8, DOL18, and DOL28 mice; DAPI nuclear stain (blue). C) amount of phosphorylated EGFR in the colon epithelium colon of DOL8,18, or 28 mice measured by ELISA. D) GAPs per crypt (colon) or villus (SI) cross section in DOL8, 18, or 28 SPF housed mice in the presence or absence of EGFR inhibition (EGFRi). E) Ratio of GAPs per GC and F) percentage of LP-MNPs cells staining with luminal ova-647 in the SI and colon of DOL7, 14, 21, or 28 mice lacking EGFR in GCs or Cre negative littermate controls. G–J) Mice were treated with vehicle or inhibition of EGFR activation (EGFRi) on DOL14 and 16 or 24 and 26 and LP-MNPs isolated or TCR transgenic T cells adoptively transferred on DOL18 or 28 respectively. G) Fold increase in CBir1 transgenic T cells after ex vivo culture with LP-MNPs from colon isolated on DOL18 or DOL28. H) Percent of CD45.1+ CBir1 or DP1 cells of total CD4+ T cells in the MLNs three days following transfer into recipient mice on DOL18 or DOL 28. I) Percent of naïve (CD62L+) CBir1 or DP1 cells in the MLNs three days following transfer into recipient mice on DOL18 or DOL28. J) Percent of Foxp3+ CBir1 or DP1 cells in the colon LP seven days following transfer into recipient mice on DOL18 or DOL 28. * = p<0.05, ns = not significant, n = 4 mice per group. Experiments in A–D, and H were repeated three independent times, E–G, and I–J were repeated two independent times.
Figure 4
Figure 4. Luminal EGF inhibits GAPs and antigen delivery prior to weaning
A) Concentration of EGF in the luminal contents of the stomach, SI, or colon in on DOL7, 14, or 21. B) Concentration of EGF in the luminal contents, C) amount of phosphorylated EGFR in the epithelium or D) amount of phosphorylated p42/p44 MAPK in the epithelium of SI segments or colon of DOL14 mice measured by ELISA; SI segments, 1=0–6 cm, 2=6–12 cm, 3=12–18cm, 4=18–24cm measured from the pylorus. E) Ratio of GAPs per GC following incubation with stomach contents (SC) from DOL10 mice, or recombinant EGF (EGF) in the presence or absence of EGFR inhibition (EGFRi) or p42/p44MAPK inhibition (MAPKi). F) Fold increase in Ova specific OTI T cells after culture with colonic LP-MNPs isolated from DOL18 mice lacking EGFR in GCs or Cre negative littermate controls given luminal Ova or PBS and treated with intracolonic EGF, i.p. tropicamide (Trop), or untreated (Control). G) Percentage of CBir1 T cells of total CD4+ T cells in the MLNs three days following cell transfer into DOL18 in mice that received intracolonic EGF (1μg) or PBS daily from DOL10-21. * = p <0.05, ns = not significant, n = 4 mice per group. Experiments in A–D, F, and G were repeated two independent times. E was repeated three independent times.
Figure 5
Figure 5. Inhibiting or altering the timing of microbial antigen encounter results in inflammatory T cell responses against gut bacteria
A) percentage of CD45.1+ CBir1 T cells of total colon LP CD4+ T cells or B) percentage of Foxp3+ or C) IL-17+, TNFα+, or IFNγ+ CBir1 T cells among all CBir1 T cells in the colon LP following transfer on DOL16 and analysis on DOL30 in mice treated with intracolonic (ic) vehicle (PBS), or EGF on DOL10-21. D) percentage of CD45.1+ CBir1 T cells of total colon LP CD4+ T cells or E) percentage of Foxp3+ or F) IL-17+, TNFα+, or IFNγ+ CBir1 T cells among all CBir1 T cells in the colon LP following transfer on DOL16 and analysis on DOL30 in mice treated with inhibition of EGFR activation (EGFRi) on DOL14 and 16, or on DOL24 and 26. * = p<0.05, ns = not significant, n = 4 mice per group.
Figure 6
Figure 6. Inhibiting or altering the timing of microbial antigen encounter results in inflammatory T cell responses against gut bacteria and worsened colitis upon epithelial damage
A–F) Mice were given intracolonic PBS or EGF on DOL10-21 or G–L) inhibition of EGFR activation (EGFRi) on DOL 14 and 16 or 24 and 26, adoptively transferred CBir1 T cells on DOL 16, given DSS in drinking water from DOL30-38. A) and G) Weight loss B) and H) histology score C) and I) colon length, D) and J) percentage of CBir1 T cells in the colon LP and percentage of E) and K) Foxp3+ and F) and L) percentage of IL-17+, TNFα+, or IFNγ+ CBir1 T cells following 8 days of DSS treatment. * = p<0.05, ns = not significant, n = 4 mice per group.
Figure 7
Figure 7. Deletion of GCs or GAPs during early life results in inflammatory T cell responses against gut bacteria and worsened colitis later in life
A) Enumeration of GCs and GAPs per colonic crypt in DOL18 GC deficient mice or mice with mAChR4 deleted from GCs and their littermate controls. A–F) GCs were deleted beginning on DOL12 or G–K) mAChR4 was deleted from GCs between DOL10-21, CBir1 T cells adoptively transferred on DOL16, and mice placed on DSS from DOL30-38. B and G) Weight loss C) and H) histology score D) and I) colon length, E) and J) percentage of CBir1 T cells expressing Foxp3, and F and K) percentage of CBir1 T cells expressing IL17, TNFα, or IFNγ in the colon LP following 8 days of DSS treatment. * = p<0.05, ns = not significant, n = 4 mice per group A–F, n=3 mice per group G–K.
Figure 8
Figure 8
Summary Schematic

Comment in

References

    1. Turnbaugh PJ, et al. The human microbiome project. Nature. 2007;449:804–810. - PMC - PubMed
    1. Ng KM, et al. Microbiota-liberated host sugars facilitate post-antibiotic expansion of enteric pathogens. Nature. 2013;502:96–99. - PMC - PubMed
    1. Kim YG, et al. Neonatal acquisition of Clostridia species protects against colonization by bacterial pathogens. Science. 2017;356:315–319. - PMC - PubMed
    1. Subramanian S, et al. Persistent gut microbiota immaturity in malnourished Bangladeshi children. Nature. 2014;510:417–421. - PMC - PubMed
    1. Charbonneau MR, et al. Sialylated Milk Oligosaccharides Promote Microbiota-Dependent Growth in Models of Infant Undernutrition. Cell. 2016 - PMC - PubMed

Publication types

Substances