. 2018 Feb 9;293(6):2195-2205.
doi: 10.1074/jbc.RA117.000700. Epub 2017 Dec 15.

Distinct pH dependencies of Na+/K+ selectivity at the two faces of Na,K-ATPase

Affiliations

Distinct pH dependencies of Na+/K+ selectivity at the two faces of Na,K-ATPase

Flemming Cornelius et al. J Biol Chem. .

Abstract

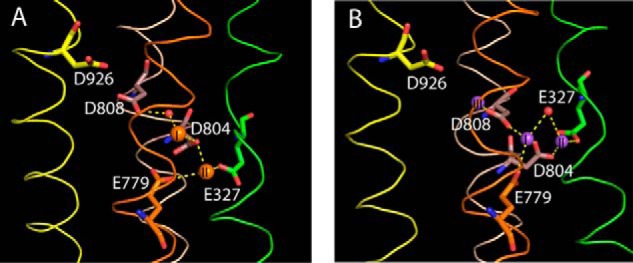
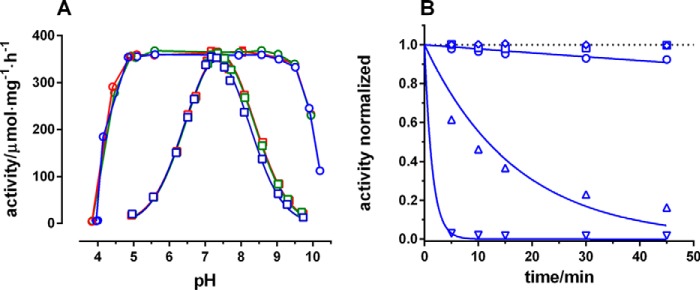
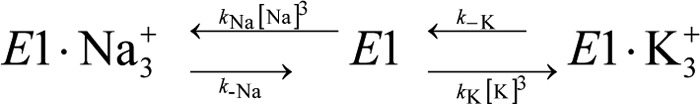
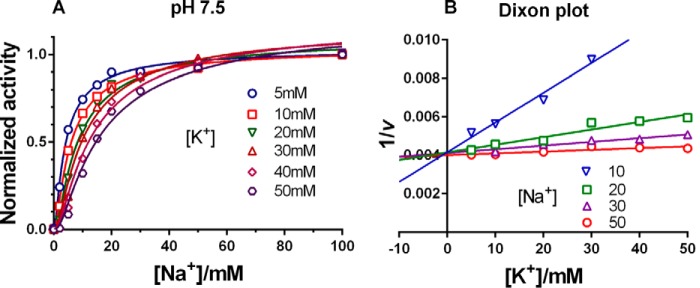
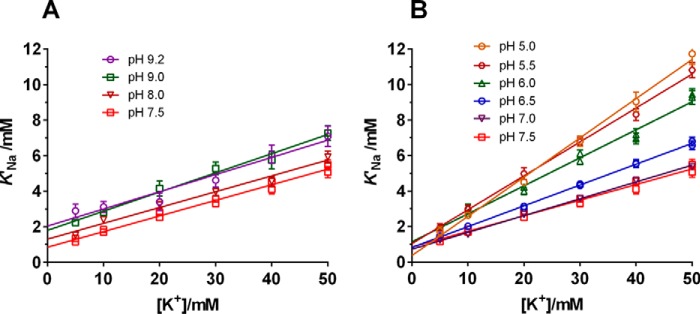
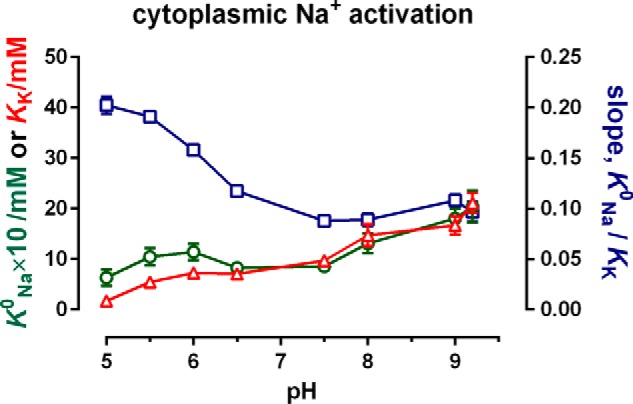
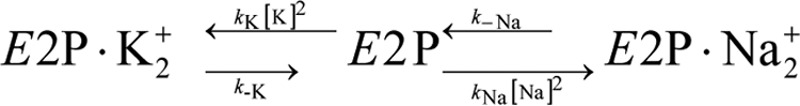
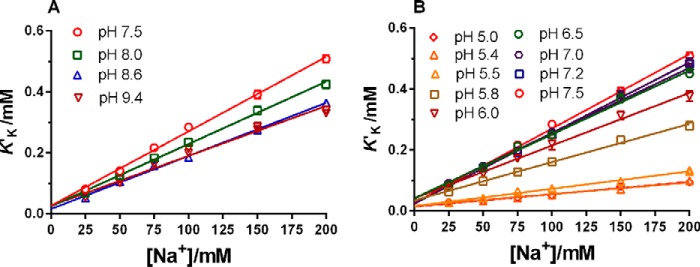
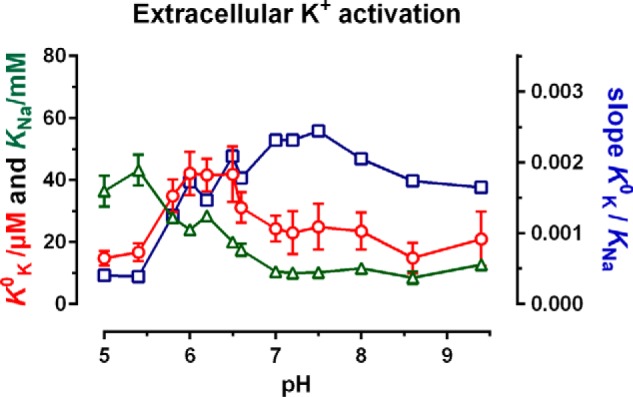
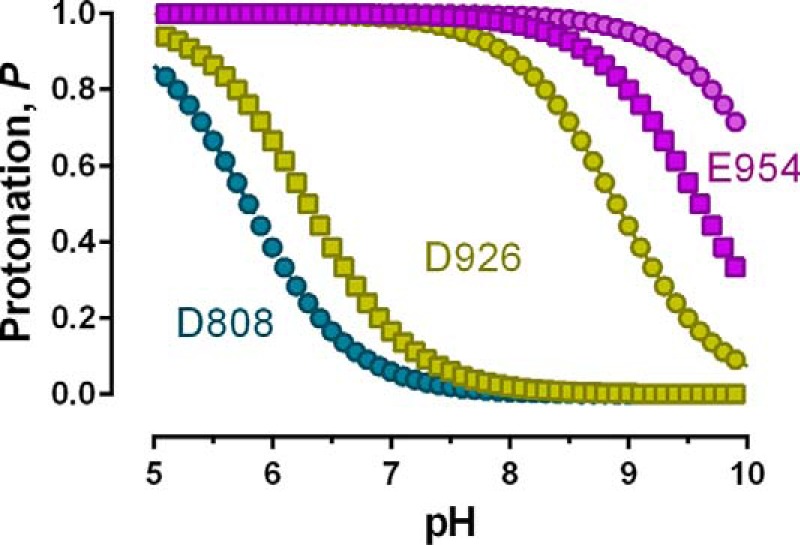
The sodium pump (Na,K-ATPase) in animal cells is vital for actively maintaining ATP hydrolysis-powered Na+ and K+ electrochemical gradients across the cell membrane. These ion gradients drive co- and countertransport and are critical for establishing the membrane potential. It has been an enigma how Na,K-ATPase discriminates between Na+ and K+, despite the pumped ion on each side being at a lower concentration than the other ion. Recent crystal structures of analogs of the intermediate conformations E2·Pi·2K+ and Na+-bound E1∼P·ADP suggest that the dimensions of the respective binding sites in Na,K-ATPase are crucial in determining its selectivity. Here, we found that the selectivity at each membrane face is pH-dependent and that this dependence is unique for each face. Most notable was a strong increase in the specific affinity for K+ at the extracellular face (i.e. E2 conformation) as the pH is lowered from 7.5 to 5. We also observed a smaller increase in affinity for K+ on the cytoplasmic side (E1 conformation), which reduced the selectivity for Na+ Theoretical analysis of the pKa values of ion-coordinating acidic amino acid residues suggested that the face-specific pH dependences and Na+/K+ selectivities may arise from the protonation or ionization of key residues. The increase in K+ selectivity at low pH on the cytoplasmic face, for instance, appeared to be associated with Asp808 protonation. We conclude that changes in the ionization state of coordinating residues in Na,K-ATPase could contribute to altering face-specific ion selectivity.

Keywords: ATPase; E1/E2 conformations; enzyme kinetics; enzyme mechanism; membrane protein; membrane transport; pH; pKa; protonation of binding sites.


Conflict of interest statement

The authors declare that they have no conflicts of interests with the contents of this article

Figures

Figure 1.
Figure 1.
Coordinating residues in the K+ (A)- and Na+ (B)-binding sites viewed approximately parallel to the membrane. The M4 helix is green, M5 is orange, M6 is wheat-colored, and M8 is yellow. Orange spheres indicate K+ ions and violet spheres Na+ ions, and the red sphere is water.
Figure 2.
Figure 2.
pH dependence of hydrolytic activity (23 °C) at three different K+ concentration (5, 20, and 50 mm) with the sum of [Na+] + [K+] = 150 mm. Measurements are an average of three measurements with S.D. represented by the error bars (smaller here than the symbols). In A, the square symbols represent activity measured at the indicated pH. The pH optimum is 7.41 ± 0.010 for 5 mm K+ (green squares), 7.41 ± 0.006 for 20 mm K+ (red squares), and 7.32 ± 0.009 for 50 mm K+ (blue squares). The stability of the enzyme at the various pH values was tested by preincubating the enzyme at the test pH for 15 min followed by measuring the activity at the pH optimum of 7.4 (circles). As indicated, the enzyme is completely stable at pH values between 5.0 and 9.5. Outside of this pH interval, irreversible inactivation occurs at all K+ concentrations tested. B, the inactivation curves in the presence of 100 mm Na+ and 50 mm K+ at different pH values (▿, pH 4.0; □, pH 5.0; ♢, pH 7.2; ○, pH 9.5; ▵, pH 10.2). The enzyme was preincubated at the indicated pH for variable time periods, and the activity was then measured at pH 7.4. The curves are exponential fits to the data, with no constraints on the fit parameters. The first-order rate constants of inactivation are 0.70 ± 0.06 min−1 at pH 4.0, 0.0021 ± 0.002 min−1 at pH 9.5, and 0.059 ± 0.004 min−1 at pH 10.2.
Figure 3.
Figure 3.
Trypsin fingerprint of enzyme incubated at pH 4, 7.4, and 10 in the presence of either 150 mm NaCl (E1) or 150 mm KCl (E2) followed by trypsin digestion at pH 7.4. Right, Coomassie-stained SDS gel. Left, immunoblot reacted with anti-α antibody raised to the C terminus. Arrows indicate variable band patterns in E1 and E2 at pH 7.4.
Scheme 1
Scheme 1
Figure 4.
Figure 4.
Na+ activation of Na,K-ATPase activity at pH 7.5 at different fixed K+ concentrations between 5 and 50 mm. A, the data are normalized (v/Vmax) and are an average of three measurements with S.D. represented by the error bars (smaller here than the symbols). For each fixed K+ concentration the enzyme activity is measured as a function of the Na+ concentration. The curves are fit using Equation 1, taking nH = 3 with K+ competing at three cytoplasmic Na+ sites. B, a Dixon plot with 1/v plotted against inhibitor concentration, [K+] at different fixed substrate concentrations, [Na+]. The intersection point is approximately at 1/Vmax.
Figure 5.
Figure 5.
The intrinsic site dissociation constant for Na+ evaluated using Equation 1 as a function of the fixed K+ concentration at high pH values (A) and low pH values (B). The lines are computer-fit to the data using Equation 2, with no constraints on fit parameters.
Figure 6.
Figure 6.
The apparent dissociation constant for Na+ in the absence of K+, KNa0 × 10 (○), and the apparent dissociation constant for K+, KK (▵), and their ratio (slope) (□) as deduced from the y and x intercepts and the slopes of the linear fit shown in Fig. 4.
Scheme 2
Scheme 2
Figure 7.
Figure 7.
K+ activation of Na,K-ATPase activity at pH 7.5 at different fixed Na+ concentrations between 50 and 200 mm. A, the data are normalized (v/Vmax) and are an average of three measurements with S.D. represented by the error bars (smaller than the symbols). For each fixed Na+ concentration the enzyme activity is measured as a function of the K+ concentration. The curves are fit using Equation 3, with Na+ competing at two extracellular K+ sites. B, Dixon plot with 1/v plotted against the inhibitor concentration, [Na+], at different fixed substrate concentrations, [K+]. The intersection point is approximately at 1/Vmax.
Figure 8.
Figure 8.
The intrinsic site dissociation constant for K+ evaluated using Equation 3 as a function of the fixed Na+ concentrations at various pH values. The lines are fit using Equation 4, with no constraints on fit parameters.
Figure 9.
Figure 9.
The apparent dissociation constant for K+ in the absence of Na+ (○), K+/Na+ selectivity, the slope (□), and the apparent dissociation constant for Na+ (▵) as deduced from the y and x intercepts and slope of the linear fit shown in Fig. 7.
Figure 10.
Figure 10.
The reaction cycle of Na,K-ATPase with the two high-resolution crystal structures framed.
Figure 11.
Figure 11.
Protonation of acidic residues that are not strongly coupled in the K+- and Na+-binding sites as a function of pH using the pKa values calculated by PROPKA 3.1 (Table 1) and the Henderson-Hasselbalch equation. ■, E1 state; ●, E2 state.
Figure 12.
Figure 12.
Distance between coordinating residues around the K+ ion-binding site (left, PDB ID 2ZXE) and the Na+ ion-binding sites (right, PDB ID 3WGV, protomer A). Critical distances (Å) to carboxylate oxygens of key acidic residues (green sticks) are shown.

Similar articles

Cited by

References

    1. Kaplan J. H. (2002) Biochemistry of Na,K-ATPase. Annu. Rev. Biochem. 71, 511–535 10.1146/annurev.biochem.71.102201.141218 - DOI - PubMed
    1. Therien A. G., and Blostein R. (1999) K+/Na+ antagonism at cytoplasmic sites of the Na+-K+-ATPase: A tissue-specific mechanism of sodium pump regulation. Am. J. Physiol. Cell Physiol. 277, C891–C898 10.1152/ajpcell.1999.277.5.C891 - DOI - PubMed
    1. Kanai R., Ogawa H., Vilsen B., Cornelius F., and Toyoshima C. (2013) Crystal structure of a Na+-bound Na+,K+-ATPase preceding the E1P state. Nature 502, 201–206 10.1038/nature12578 - DOI - PubMed
    1. Breitwieser G. E., Altamirano A. A., and Russell J. M. (1987) Effects of pH on sodium pump fluxes in squid giant axons. Am. J. Physiol. Cell Physiol. 253, C547–C554 10.1152/ajpcell.1987.253.4.C547 - DOI - PubMed
    1. Salonikidis P. S., Kirichenko S. N., Tatjanenko L. V., Schwarz W., and Vasilets L. A. (2000) Extracellular pH modulates kinetics of the Na+,K+-ATPase. Biochim. Biophys. Acta 1509, 496–504 10.1016/S0005-2736(00)00356-4 - DOI - PubMed

Publication types