. 2018 Jan 2;215(1):357-375.
doi: 10.1084/jem.20171389. Epub 2017 Dec 15.

Mannose receptor high, M2 dermal macrophages mediate nonhealing Leishmania major infection in a Th1 immune environment

Affiliations

Mannose receptor high, M2 dermal macrophages mediate nonhealing Leishmania major infection in a Th1 immune environment

Sang Hun Lee et al. J Exp Med. .

Abstract

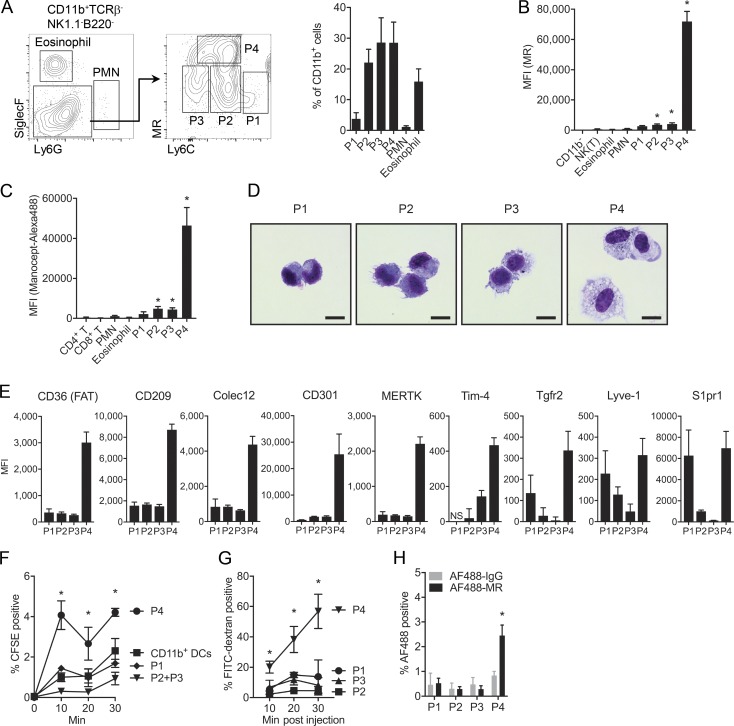
The origin and functional specialization of dermal macrophages in cutaneous infections have been little studied. In this paper, we show that a strain of Leishmania major (L. major Seidman [LmSd]) that produces nonhealing cutaneous lesions in conventionally resistant C57BL/6 mice was more efficiently taken up by M2-polarized bone marrow (BM)-derived macrophages (BMDMs) in vitro and by mannose receptor (MR)hi dermal macrophages in vivo compared with a healing strain (L. major Friedlin V1). Both in steady and in T helper type 1 (Th1) cell-driven inflammatory states, the MRhi dermal macrophages showed M2 characteristics. The dermal macrophages were radio resistant and not replaced by monocytes or adult BM-derived cells during infection, but were locally maintained by IL-4 and IL-10. Notably, the favored infection of M2 BMDMs by LmSd in vitro was MR dependent, and genetic deletion of MR or selective depletion of MRhi dermal macrophages by anti-CSF-1 receptor antibody reversed the nonhealing phenotype. We conclude that embryonic-derived, MRhi dermal macrophages are permissive for parasite growth even in a strong Th1-immune environment, and the preferential infection of these cells plays a crucial role in the severity of cutaneous disease.


Figures

Figure 1.
Figure 1.
The MR mediates preferential uptake of nonhealing L. major strains by BMDMs in vitro. (A) BMDMs from C57BL/6 mice were infected with metacyclic promastigotes at an MOI of 4 for 5 h, washed three times, and incubated for 1, 2, and 3 d. Giemsa-stained cells were scored for the percentage of total cells infected and the mean number of parasites per infected cell at each time point. (B) BMDMs were infected with amastigotes at an MOI of 1 for 1, 3, and 6 h, washed three times, and incubated for 1, 2, 3, and 4 d. (A and B) n = 4; data representative of three independent experiments. (C and D) Development of nodular lesions over the course of infection with 103 metacyclic promastigotes of the parental clones (Sd and Fn) and their genetic hybrids (FnSd1, FnSd4A, FnSd6F, FnSd3, FnSd4B, and FnSd4C; n = 8; data representative of two independent experiments). (E) BMDMs were infected with metacyclic promastigotes of the parental and hybrid clones at an MOI of 4 for 5 h. Giemsa-stained cells were scored for the percentage of total cells infected (n = 4; data representative of two independent experiments). (F) BMDMs were pretreated with BSA-mannose or RGDS for 5 h and infected with metacyclic promastigotes at an MOI of 4 for 5 h (n = 4; data representative of three independent experiments). (G) BMDMs were pretreated with BSA-mannose for 5 h and infected with amastigotes at an MOI of 1 for 3 h (n = 4; data representative of two independent experiments). (H and I) BMDMs from WT, cr3−/−, and c3−/− mice (H) or from WT and mrc−/− mice (I) were infected with metacyclic promastigotes at an MOI of 4 for 5 h (n = 4; data representative of two independent experiments). Giemsa-stained cells were scored for the percentage of total of cells infected. (J) MR expression on M-CSF–induced BMDMs or GM-CSF–induced BMDCs (data representative of two independent experiments). (K) MR expression on BMDMs treated with 50 ng/ml IFN-γ, 10 ng/ml LPS, 10 ng/ml IL-4, 10 ng/ml IL-10, 10 ng/ml IL-13, or combinations for 48 h (n = 6; data representative of two independent experiments). (L) Giemsa-stained BMDMs were scored for the percentage of total cells infected that were prestimulated with either 10 ng/ml LPS and 50 ng/ml IFN-γ (M1) or 10 ng/ml IL-4 and 10 ng/ml IL-10 (M2) for 24 h, followed by infection with metacyclic promastigotes at an MOI of 4 for 5 h, and incubated for 1, 2, and 3 d (n = 4; data representative of two independent experiments). Values represent mean ± standard deviation. *, P < 0.05 by nonparametric Mann-Whitney test (A, B, F–I, and L) and by one-way ANOVA with Dunn’s posttest compared with LmSd (E) or with nontreated WT (K).
Figure 2.
Figure 2.
MR identifies a population of highly phagocytic M2 macrophages in the steady-state dermis. (A) Representative flow cytometric analysis of ear isolates prepared from naive mice. CD11b+Ly6GSiglecF-gated cells were analyzed for the expression of Ly6C and MR and subdivided into a Ly6ChiMRlo (P1), Ly6CintMRlo (P2), Ly6CloMRlo (P3), and Ly6CintMRhi (P4). Bar graph shows the frequencies of the myeloid subsets identified. (B) Mean fluorescence index (MFI) for MR expression on indicated populations isolated from naive ears. (A and B) n = 6; data representative of three independent experiments. (C) MFIs of the labeled populations were quantified at 1 h after intravenous injection of 5 µg Manocept–Alexa Fluor 488 (n = 6; data representative of two independent experiments). PMN, polymorphonuclear leukocyte. (D) Light micrographs of Wright-Giemsa–stained P1–P4 populations sorted from naive ear. Bars, 10 µm (data representative of more than five independent experiments). (E) MFIs for selected M2 macrophage markers expressed on P1–P4 populations from naive ear. Background MFIs of isotype controls were subtracted (n = 6; data representative of two independent experiments; negative values are not depicted). (F) Uptake of apoptotic thymocytes by indicated populations of myeloid cells. Mice were injected in the ear dermis with 106 CFSE-labeled apoptotic thymocytes and sacrificed at 10–30 min for flow cytometric analysis of CFSE labeling in the ear dermal cells (n = 4; data representative of three independent experiments). (G and H) Flow cytometric analysis of the uptake of intraluminal dextran or anti-MR antibodies after intravenous injection with 2 MD FITC-dextran or Alexa Fluor 488–anti-MR antibodies (H) and sacrificed at 10–30 min or 3 min, respectively (n = 4; data representative of two independent experiments). Values represent mean ± standard deviation. *, P < 0.05 by one-way ANOVA with Dunn’s posttest (B, C, F, and G) and by nonparametric Mann-Whitney test (H).
Figure 3.
Figure 3.
P4 dermal macrophages do not originate from blood precursors. (A) Representative flow cytometric analysis of ear isolates prepared from day 12–infected ears after infection with 2 × 10⁵ LmSd (data representative of three independent experiments). (B) The total numbers of the indicated populations of the dermal cells in WT mice infected with 2 × 10⁵ LmSd metacyclics (n = 6; data representative of three independent experiments). (C) Representative dot plots of GFP+ cells within each of the P1–P4 populations in cx3cr1-gfp mice infected with 2 × 10⁵ LmSd metacyclics for 2, 5, 8, and 12 d. The graph shows the percentage of each population, P1–P4, that was CXCR1-GFP+. (D) CD45.1+GFP+ monocytes were sorted from BM cells of cx3cr1-gfp mice and adoptively transferred into CD45.2+ C57BL/6 mice infected for 7 d with 2 × 10⁵ LmSd. Representative dot plots showing adoptively transferred CD45.1+GFP+ monocytes (black) overlaid onto the P1–P4 populations (gray) and the GFP expression on the CD45.1+ cells recovered from the ear dermis at different times after adoptive transfer. Bar graphs show the percentage of the total CD45.1+ cells found in each population and the percentage of the total CD45.1+ cells that remained GFP+. p.t., post transfer. (E) The ratio between cells of donor origin (CD45.2, gray bars) and recipient origin (CD45.1, black bars) from ear isolates of BM chimeras at 1, 2, and 4 wk after BM transfer. A group of mice were infected with 2 × 10⁵ LmSd at 2 wk after BM transfer and analyzed after another 2 wk. (F) Representative dot plots and bar graph showing the percentages of chimerism in the indicated populations present in the noninfected or infected ears of parabiotic mice for 12 d with 2 × 10⁵ LmSd. (C–F) n = 4; data representative of two independent experiments. PMN, polymorphonuclear leukocyte. Values represent mean ± standard deviation. *, P < 0.05 by one-way ANOVA with Dunn’s posttest compared with day 2 p.i. (B) and day 1 after transfer (D).
Figure 4.
Figure 4.
LmSd selectively infects P4 dermal macrophages. (A) Light microscopic appearance of Wright-Giemsa–stained P1–P4 populations sorted from infected ears. Arrowheads indicate amastigotes (data representative of more than five independent experiments). (B) Immunofluorescence staining and confocal microscopy on vertical sections of an infected ear showing LmSd-RFP (red), MR (cyan), and Hoechst 33342 (blue). Insets 1–6 show boxed areas at higher magnification. Dashed lines depict auricular cartilage. Thin white lines in insets 4 and 5 indicate corresponding points in the orthogonal planes, showing localization of RFP+ parasites within the MR+ cell. Arrowheads indicate hair follicles (data representative of two independent experiments). (C–E) Percentages of total (C) or RFP+-infected (D) myeloid populations recovered from the ear at 2, 5, and 12 d p.i. with 2 × 10⁵ RFP+ LmSd and LmFn and parasite loads per infected ear (E). (F and G) Parasite loads per infected ear (F) and percentages of RFP+-infected populations, P1–P4 (G), recovered from the ear at 9 and 12 wk p.i. with 103 RFP+ LmSd and LmFn. (C–F) n = 6; data representative of two independent experiments. Values represent mean ± standard deviation. *, P < 0.05; **, P ≤ 0.01 by nonparametric Mann-Whitney test (D and E). Bars: (A) 10 µm; (B) 100 µm; (except insets 4 and 5) 5 µm.
Figure 5.
Figure 5.
Genetic ablation of MR on P4 dermal macrophages reverses nonhealing infection with LmSd. (A and B) Lesion development and pathology scores (0 = no ulceration, 1 = ulcer, 2 = half ear eroded, 3 = ear completely eroded) over the course of infection (A) and parasite burdens at 15 wk p.i. with 103 LmSd metacyclic promastigotes in the ear dermis of indicated mice (B; n = 6–8; data representative of three independent experiments). (C–E) Reciprocal BM chimeras were generated between CD45.1+ WT and CD45.2+ mrc−/− mice. These BM chimeras were infected with 103 LmSd metacyclic promastigotes 4 wk after BM transfer. (C) The ratio between CD45.1+ WT and CD45.2+ mrc−/− cells from ear isolates of BM chimeras at 16 wk after BM transfer and 12 wk p.i. are shown (n = 10; data representative of two independent experiments). Each population was defined according to the gating scheme shown in Fig. S2 C using MR-independent markers. PMNs, polymorphonuclear leukocytes. (D and E) Lesion development (D) and parasite loads (E) at 12 wk p.i. are shown (n = 8–10; data representative of two independent experiments). Values represent mean ± standard deviation. *, P < 0.05; **, P ≤ 0.01 by one-way ANOVA with Dunn’s posttest compared with LmSd-infected WT (A, B, D, and E).
Figure 6.
Figure 6.
Depletion of P4 dermal macrophages with anti–CSF-1R antibody ameliorates nonhealing infection with LmSd. (A) Representative contour plots and bar graphs showing the frequency and total numbers of myeloid subsets recovered from the ear after treatment with M279 three times a week for 3 wk. (B) Total numbers of myeloid subsets recovered from the ears of control-treated or M279-treated mice for 3 wk and then infected for 9 d with 2 × 10⁵ LmSd (n = 6; data representative of two independent experiments). PMNs, polymorphonuclear leukocytes. (C and D) Lesion development and pathology scores (0 = no ulceration, 1 = ulcer, 2 = half ear eroded, 3 = ear completely eroded) over the course of infection (C) and parasite burdens at 15 wk p.i. in the ear dermis of C57BL/6 mice treated with either M279 or control IgG three times a week for 9 wk (D; n = 8; data representative of two independent experiments). Mice were infected with 103 metacyclic promastigotes after the first 3 wk of treatment. Values represent mean ± standard deviation. *, P < 0.05; **, P ≤ 0.01; ***, P ≤ 0.0001 by nonparametric Mann-Whitney test (A and B) and by one-way ANOVA with Dunn’s posttest compared with LmSd-infected WT (C and D).
Figure 7.
Figure 7.
P4 dermal macrophages express M2 functionality and remain permissive to LmSd infection. (A) Representative dot plots and bar graphs showing the frequency of P1–P4 staining positive for iNOS, Arginase1, or Relm-α at 9 wk and 12 wk p.i. with 103 LmSd-RFP (n = 6; data representative of two independent experiments). (B) RFP+ P1–P4 populations were sorted from C57BL/6 mice at 9 wk p.i. and incubated in vitro for 24–48 h. Giemsa-stained cells were scored for the mean number of parasites per infected cell at each time point (n = 4; data representative of two independent experiments). Values represent mean ± standard deviation. *, P < 0.05 by one-way ANOVA with Dunn’s posttest compared with no incubation control (B).
Figure 8.
Figure 8.
P4 dermal macrophages are locally maintained by IL-4 and IL-10 during infection. (A) Representative contour plots and bar graphs showing the frequency and absolute number of P1–P4 populations in C57BL/6, il4−/−, il10−/−, and il4/10−/− mice at day 12 p.i. with 2 × 10⁵ LmSd. (B) The quantification of MR expression on CD11b+CCR2hiCD64loLy6ChiMHCII monocytes, CD11b+CCR2hiCD64loLy6CintMHCIIint moDCs, CD11b+CCR2hiCD64loLy6CloMHCIIhi moDCs, and CD11b+CCR2loCD64hiLy6CintMHCII dermal macrophages in C57BL/6, il4−/−, il10−/−, and il4/10−/− mice at day 12 p.i. with 2 × 10⁵ LmSd. The frequencies of the same populations were quantified in the bottom graph. (C and D) Ki67 expression or BrdU incorporation by P4 dermal macrophages from naive or infected WT and il4−/− mice at 12 d p.i. with 2 × 10⁵ LmSd. (A–D) n = 6; data representative of two independent experiments. (E) Bar graphs showing the IL-4Rα and IL-10Rα expression levels on P1–P4 populations in naive C57BL/6 (n = 4; data representative of two independent experiments). Background MFIs of isotype controls were subtracted. (F and G) Parasite burdens at 2 wk p.i. with 2 × 10⁵ metacyclic promastigotes (F; n = 10; data representative of three independent experiments) and lesion development over the course of infection with 103 metacyclic promastigotes in the ear dermis of C57BL/6, il4−/−, Il10−/−, and il4/10−/− mice (G; n = 8–10; data representative of three independent experiments). Values represent mean ± standard deviation. *, P < 0.05; **, P ≤ 0.01; ***, P ≤ 0.001; ****, P ≤ 0.0001 by nonparametric Mann-Whitney test (C, D, and G) and by one-way ANOVA with Dunn’s posttest compared with WT C57BL/6 mice (A, B, and F) and P1 (E).
Figure 9.
Figure 9.
IL-1R and inflammasome activation contribute to the maintenance of the P4 dermal macrophages during infection. (A) Representative dot plots and bar graph showing the frequency of CD11b+IL-1β+ cells overlaid onto CD11b+ cells from C57BL/6 mice infected with 103 LmSd and recovered from the ear dermis at 12 wk p.i. (n = 4; data representative of three independent experiments). (B) The frequency of CD4+ T, CD8+ T, and natural killer T cells (NK[T]) in ear lesions stained positive for IFN-γ, IL-10, and IL-4 at 12 wk p.i. with 103 LmSd (n = 6; data representative of three independent experiments). (C) Representative dot plots show the frequency of dermal P1–P4 populations in C57BL/6, casp1−/−, il1r−/−, and il4−/− mice at 12 wk p.i. with 103 LmSd. Bar graphs show the absolute number and frequency of P4 and eosinophils (n = 6–8; data representative of three independent experiments). Values represent mean ± standard deviation. *, P < 0.05; **, P ≤ 0.01; ***, P ≤ 0.001; ****, P ≤ 0.0001 by one-way ANOVA with Dunn’s posttest compared with WT C57BL/6 mice (B and C).

Comment in

Similar articles

Cited by

References

    1. Akilov O.E., Kasuboski R.E., Carter C.R., and McDowell M.A.. 2007. The role of mannose receptor during experimental leishmaniasis. J. Leukoc. Biol. 81:1188–1196. 10.1189/jlb.0706439 - DOI - PubMed
    1. Allen J.E., and Sutherland T.E.. 2014. Host protective roles of type 2 immunity: parasite killing and tissue repair, flip sides of the same coin. Semin. Immunol. 26:329–340. 10.1016/j.smim.2014.06.003 - DOI - PMC - PubMed
    1. Anderson C.F., Mendez S., and Sacks D.L.. 2005. Nonhealing infection despite Th1 polarization produced by a strain of Leishmania major in C57BL/6 mice. J. Immunol. 174:2934–2941. 10.4049/jimmunol.174.5.2934 - DOI - PubMed
    1. Azad A.K., Rajaram M.V., Metz W.L., Cope F.O., Blue M.S., Vera D.R., and Schlesinger L.S.. 2015. γ-Tilmanocept, a New Radiopharmaceutical Tracer for Cancer Sentinel Lymph Nodes, Binds to the Mannose Receptor (CD206). J. Immunol. 195:2019–2029. 10.4049/jimmunol.1402005 - DOI - PMC - PubMed
    1. Barreiro O., Cibrian D., Clemente C., Alvarez D., Moreno V., Valiente Í., Bernad A., Vestweber D., Arroyo A.G., Martín P., et al. . 2016. Pivotal role for skin transendothelial radio-resistant anti-inflammatory macrophages in tissue repair. eLife. 5:5 10.7554/eLife.15251 - DOI - PMC - PubMed

Publication types

MeSH terms