. 2017 Dec 15;7(1):17676.
doi: 10.1038/s41598-017-17687-2.

Exploring Feature Dimensions to Learn a New Policy in an Uninformed Reinforcement Learning Task

Affiliations

Exploring Feature Dimensions to Learn a New Policy in an Uninformed Reinforcement Learning Task

Oh-Hyeon Choung et al. Sci Rep. .

Abstract

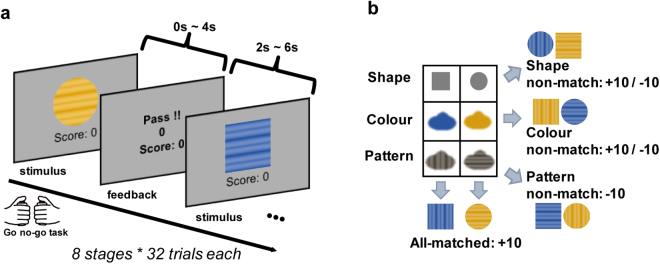
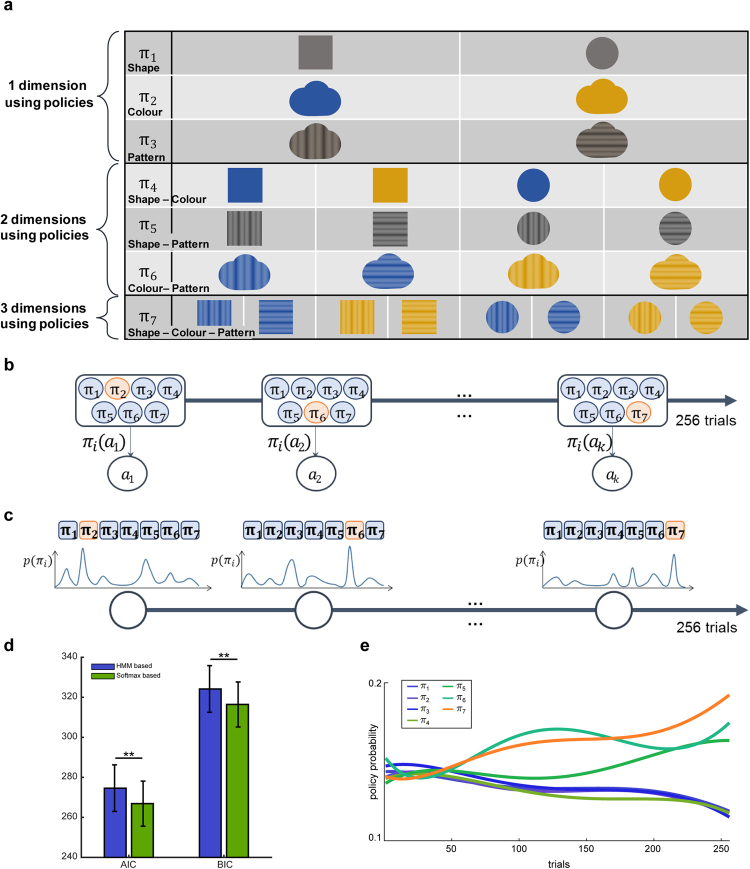
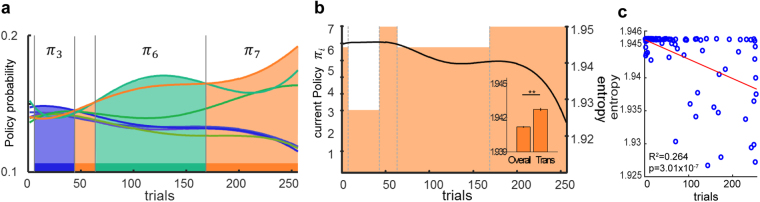
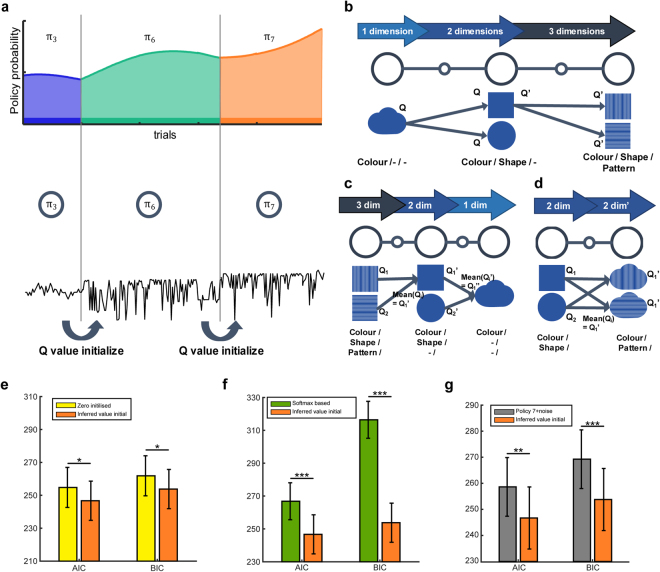
When making a choice with limited information, we explore new features through trial-and-error to learn how they are related. However, few studies have investigated exploratory behaviour when information is limited. In this study, we address, at both the behavioural and neural level, how, when, and why humans explore new feature dimensions to learn a new policy for choosing a state-space. We designed a novel multi-dimensional reinforcement learning task to encourage participants to explore and learn new features, then used a reinforcement learning algorithm to model policy exploration and learning behaviour. Our results provide the first evidence that, when humans explore new feature dimensions, their values are transferred from the previous policy to the new online (active) policy, as opposed to being learned from scratch. We further demonstrated that exploration may be regulated by the level of cognitive ambiguity, and that this process might be controlled by the frontopolar cortex. This opens up new possibilities of further understanding how humans explore new features in an open-space with limited information.


Conflict of interest statement

The authors declare that they have no competing interests.

Figures

Figure 1
Figure 1
Behavioural task design. (a) Schematic of multi-dimensional reward learning task. In each trial participants were presented with a single visual stimulus composed of three different dimensional features: shape, colour, and pattern. When each stimulus image was presented, participants were asked to make a selection by pressing the left or right button within 4 s, following which feedback was provided for a duration of 2–6 s. A total of 256 trials were presented to each participant in random order. (b) Feature dimensions of visual stimuli. When chosen images are one of the two rewarded stimuli (“all-matched” combinations) – the blue-square-vertical and the yellow-circle-horizontal patterned images – participants received +10 points. When “pattern non-match” images were selected, participants received −10 points. All other combinations (“shape non-match” and “colour non-match” images) were randomly associated with +10 or −10 points. The last two combinations were added to adjust task difficulty.
Figure 2
Figure 2
Probabilistic policy exploration model. (a) In the naïve Reinforcement Learning (RL) phase, possibly used features were abstracted as policies, as follows: π1, using shape information (1 dim), π2, using colour information (1 dim), π3, using pattern information (1 dim), π4, using combinations of colour and shape information (2 dim), π5, using combinations of shape and pattern information (2 dim), π6, using combinations of colour and pattern information (2 dim), π7, using combinations of shape, colour, and pattern information (3 dim). (b) A schematic diagram of the hidden Markov model (HMM)-based policy search model. (c) A schematic diagram of the softmax function-based policy search model. (d) Comparison of model results. blue: HMM-based model, green: Softmax function-based policy search model, paired t-test p = 0.0080, mean ± SEM. (e) Representative fitted policy probability. Each policy is represented by an individual colour.
Figure 3
Figure 3
Representative policy estimation and corresponding entropy. (a) Policy estimation. The policy with the highest probability estimate in each trial was regarded as a currently used policy. (b) Current policy within each trial (orange squares, grey dot: time-points that policy transition occurred) and policy entropy values (black line). Difference in entropy values between policy transition time-points and all the other trials (inset, paired t-test, p < 0.01, mean ± SEM). (c) Transition time-point with regard to entropy and trial order. (Blue dot: each transition time-points for all participants, red line: linear regression result.) Transition time-points were significantly related to earlier trials and higher entropy (R2 = 0.264, p = 3.01 × 10−7).
Figure 4
Figure 4
Value Transfer Learning Model. (a) Value transfer learning model with policy changes. (b,c,d) Learning based on previously learned state-action values, (b) Increasing feature dimensionality case, (c) Decreasing feature dimensionality case, (d) Policy transition without a change in feature dimensionality. (e) Model comparison between the zero initialised and learned value initialised model (paired t-test, mean ± SEM, *p < 0.05). (f) Model comparison between softmax function-based policy search model and inferred value transfer learning model (paired t-test, mean ± SEM, **p < 0.01, ***p < 0.001). (g) Model comparison between policy seven with noise model and learned value initialised model (paired t-test, mean ± SEM). Yellow, zero initialised model; orange, learned value initialised model; green, sofmax function-based policy search model; grey, policy seven with noise model.
Figure 5
Figure 5
Parametric fMRI analysis. (a) State-action value signals were encoded in intraparietal sulcus (IPS: (−21 −36 60), k = 394, FWE corr. p < 0.05), right ventral striatum (rVS: (9 12 −9), k = 61, SVC p < 0.05), and ventro-medial prefrontal cortex (vmPFC: (0 33 −9), k = 38, SVC p < 0.05). (b) Reward prediction error signals were encoded in left and right putamen (rPutamen: (27 −15 9), k = 58, SVC p < 0.05; lPutamen: (−21 9 9), k = 74, SVC p < 0.05). (c) Cognitive entropy signals were encoded in frontopolar cortex (FPC: (12 60 3), k = 20, SVC p < 0.05). FWE: whole-brain familywise error correction. SVC: small volume correction, equal threshold with p < 0.05 and k > 10 voxels of correction within 10 mm sphere centred by known peak-coordinate was applied.

References

    1. Daw ND, O’Doherty JP, Dayan P, Seymour B, Dolan RJ. Cortical substrates for exploratory decisions in humans. Nature. 2006;441:876–879. doi: 10.1038/nature04766. - DOI - PMC - PubMed
    1. Beharelle AR, Polanía R, Hare TA, Ruff CC. Transcranial Stimulation over Frontopolar Cortex Elucidates the Choice Attributes and Neural Mechanisms Used to Resolve Exploration–Exploitation Trade-Offs. Journal of Neuroscience. 2015;35:14544–14556. doi: 10.1523/JNEUROSCI.2322-15.2015. - DOI - PMC - PubMed
    1. Donoso M, Collins AG, Koechlin E. Human cognition. Foundations of human reasoning in the prefrontal cortex. Science. 2014;344:1481–1486. doi: 10.1126/science.1252254. - DOI - PubMed
    1. Schuck NW, et al. Medial prefrontal cortex predicts internally driven strategy shifts. Neuron. 2015;86:331–340. doi: 10.1016/j.neuron.2015.03.015. - DOI - PMC - PubMed
    1. Gluck MA, Shohamy D, Myers C. How do people solve the “weather prediction” task? Individual variability in strategies for probabilistic category learning. Learning & Memory. 2002;9:408–418. doi: 10.1101/lm.45202. - DOI - PMC - PubMed

Publication types

LinkOut - more resources