. 2017 Dec 15;8(1):2145.
doi: 10.1038/s41467-017-02218-4.

Cell shape information is transduced through tension-independent mechanisms

Affiliations

Cell shape information is transduced through tension-independent mechanisms

Amit Ron et al. Nat Commun. .

Abstract

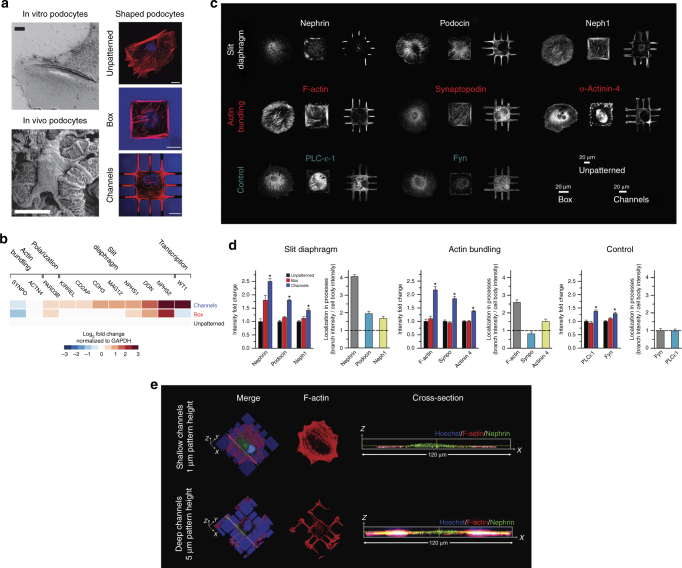
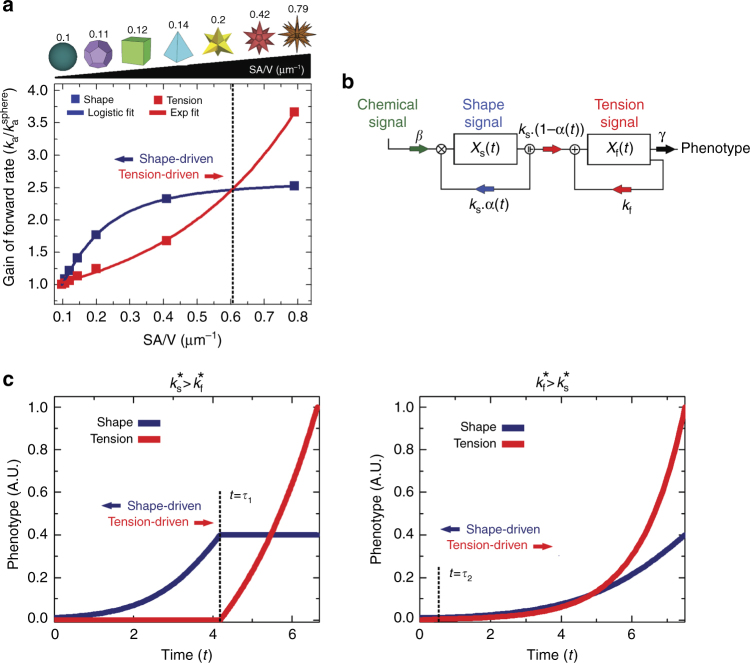
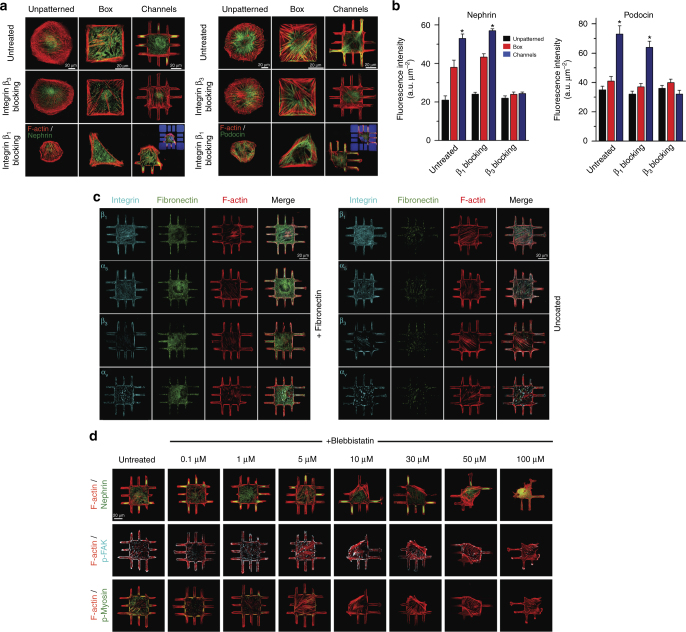
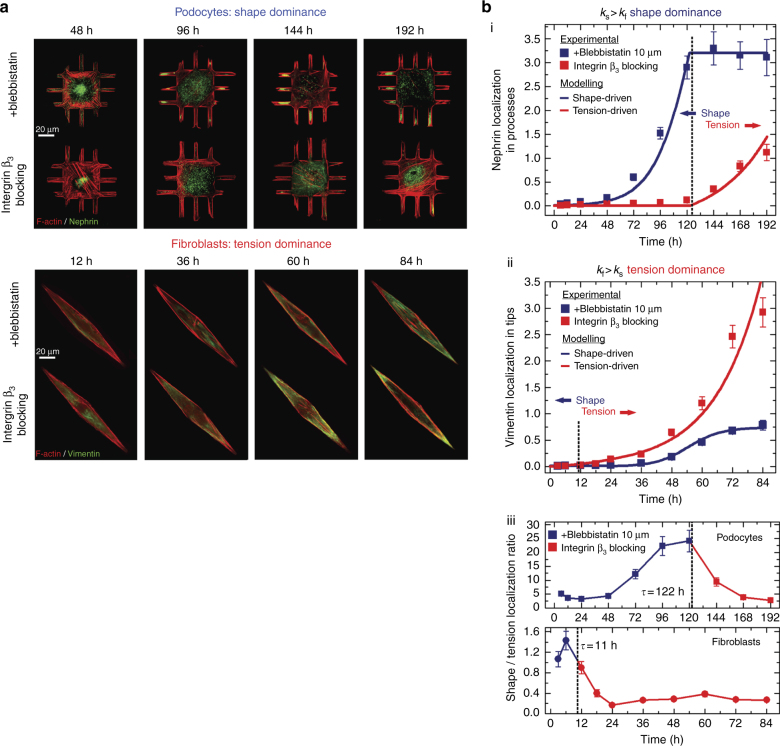
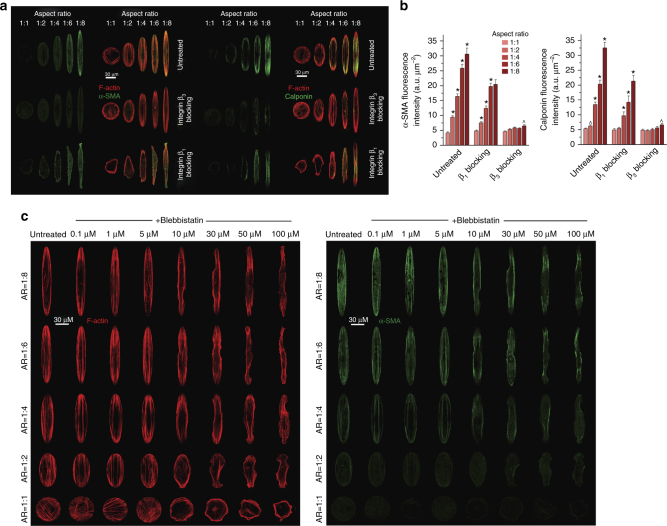
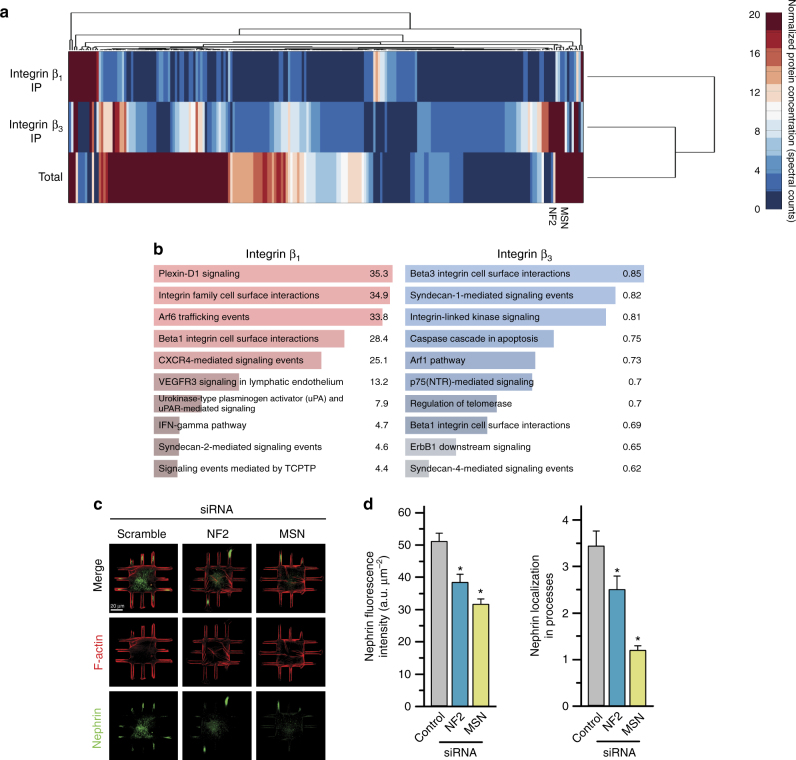
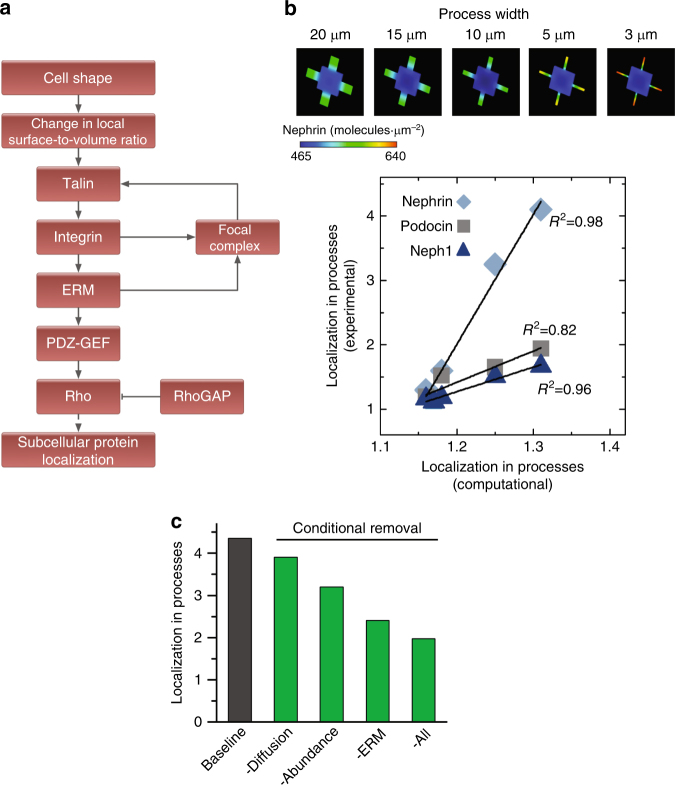
The shape of a cell within tissues can represent the history of chemical and physical signals that it encounters, but can information from cell shape regulate cellular phenotype independently? Using optimal control theory to constrain reaction-diffusion schemes that are dependent on different surface-to-volume relationships, we find that information from cell shape can be resolved from mechanical signals. We used microfabricated 3-D biomimetic chips to validate predictions that shape-sensing occurs in a tension-independent manner through integrin β3 signaling pathway in human kidney podocytes and smooth muscle cells. Differential proteomics and functional ablation assays indicate that integrin β3 is critical in transduction of shape signals through ezrin-radixin-moesin (ERM) family. We used experimentally determined diffusion coefficients and experimentally validated simulations to show that shape sensing is an emergent cellular property enabled by multiple molecular characteristics of integrin β3. We conclude that 3-D cell shape information, transduced through tension-independent mechanisms, can regulate phenotype.


Conflict of interest statement

The authors declare no competing financial interests.

Figures

Fig. 1
Fig. 1
Podocytes differentiate in response to shape signals. a (Left) Scanning electron micrograph of in vivo podocytes showing distinct processes that branch out of a central cell body; (Right) representative images of cells cultured on unpatterned glass, box, and channel micropatterns of the 3-D biochips. Cells were stained for F-actin (red) and nuclei (blue). All scale bars are 20 μm. b mRNA expression levels measured by RT-PCR for physiologically essential proteins in podocytes revealed an increase in expression of nine out of eleven transcripts for cells plated on the channel micropatterns with a median increase of 87% (mean fold change of 2.8 ± 0.9; p < 0.05 vs. UNP; one-way ANOVA followed by a post hoc Tukey test). Cells in box patterns showed a median change of 7% with an increase in six and a decrease in five transcripts (mean fold change of 1.4 ± 0.3; p = ns vs. UNP). Heatmap represents the average expression levels from four independent experiments with two slides in each group. c Representative immunofluorescence images of physiologically essential proteins in podocytes plated on unpatterned and patterned surfaces. The proteins are organized into “slit diaphragm proteins” nephrin, podocin, and neph1 (upper row), “actin-bundling proteins” F-actin, synaptopodin, and α-actinin-4 (middle row), and “control proteins” phospholipase-C-ε and Fyn (lower row). d Summary of whole-cell fluorescence intensity fold change and localization ratio (ratio of fluorescence intensity within peripheral processes vs. cell body) in micropatterned podocytes. Values given as mean ± SEM; n = 80, chosen randomly from eight different slides cultured independently at different times (*p < 0.01 vs. UNP; one-way ANOVA followed by a post hoc Tukey test). e Representative immunofluorescent confocal volume scans of podocytes cultured on shallow (1 μm) and deep (5 μm) channel patterns showing nephrin (green), F-actin (red) and nuclei (blue). On biochips with shallow micropatterns, cells did not produce high aspect ratio processes enriched for nephrin. In contrast, clear enrichment was observed in deep channels. Hence, 3-D shape is necessary for the localization phenotype
Fig. 2
Fig. 2
Multiple types of signals can regulate cellular phenotype. a Tension- (red) and shape (blue)-dependent association rate constants (K a) as functions of SA/V ratio based on a series of 3-D geometries. As the SA/V gets higher, shape signals are dominant until around SA/V ≅ 0.6 when the system becomes tension-driven. The term KaKasphere represents the relative change with respect to a spherical reference. b Control state diagram for shape and tension-driven phenotypes. The state variables X s(t) and X f(t) represent phenotypic contributions of the shape and tension signals, respectively. k s and k f represent the rates by which shape and tension signals alter the phenotype, respectively. γ is the natural decay (degradation) rate of the phenotype. β represents the probability of chemical induction via other extracellular ligands. α(t) is the control function that represents the probability of the cell to react to shape signals, and [1−α(t)] is the probability to react to tension signals. c Phenotypic state as a function of time depicting optimal solution for the dynamics of shape- (blue) and tension- (red) driven phenotypes. When ks*>kf*, shape cues are dominant in driving phenotype, whereas tension becomes the main driver when ks*<kf*
Fig. 3
Fig. 3
Integrin β3 controls shape-driven phenotype in podocytes. a Representative images of podocytes plated on unpatterned and micropatterned surfaces, and stained either for (left) nephrin (green) and F-actin (red), or (right) podocin (green) and F-actin (red). Both podocin and nephrin were highly localized within peripheral processes. Treating cells with integrin β3 blocking antibodies abolished the localization effect. Podocytes treated with integrin β1 blocking antibodies exhibit limited spreading; however, podocin and nephrin phenotype was relatively unaffected (insets show the autofluorescent patterns for clarity). b Quantitative analysis of whole-cell nephrin and podocin intensities in patterned and unpatterned podocytes treated with either β1 or β3 blocking antibodies. Values given as mean ± SEM; n = 80 chosen randomly from eight different slides cultured independently (*p < 0.01 vs. UNP; one-way ANOVA followed by a post hoc Tukey test). c No significant differences in integrin expression were observed between fibronectin coated and uncoated surfaces; spatial integrin expression did not depend on the ECM coating in 3-D micropatterned podocytes. Integrin β1, α5, β3, and αv (cyan, stained independently), fibronectin (green), and F-actin (red) in podocytes plated on channel surfaces with and without fibronectin coating. d Podocytes were treated with varying concentrations of blebbistatin for 12 h prior to fixation and stained for (top) nephrin (green) and F-actin (red), (middle) p-FAK (cyan) and F-actin (red), or (bottom) p-myosin (green) and F-actin (red). Phospho-myosin intensity decreased gradually with increasing blebbistatin concentration, whereas recruitment of p-FAK to focal adhesions was not affected by blebbistatin up to 10 μM
Fig. 4
Fig. 4
Experiments agree with the optimal control theory predictions. a Representative immunofluorescence images showing the dynamics of (top) nephrin localization in podocytes, and (bottom) vimentin localization in fibroblasts. Cells were plated on channel or rhombus micropatterns, treated with integrin β3 blocking antibodies or blebbistatin, fixed at given time points, and stained for nephrin or vimentin (green) as well as F-actin (red). b Experimentally measured localization dynamics in podocyte and fibroblasts for (i) nephrin (podocytes) and (ii) vimentin (fibroblasts) were fitted with the temporal order predicted from the optimal control solution (blue and red lines). Both cells show an excellent fit with the control models. A clear shape-tension transition is revealed which confirm the predicted strategy that cells initially respond to shape signals followed by a transition to a tension-driven mechanism. (iii) The localization ratio between shape and tension signals reveals how well the predicted switching time, t agrees with the measured dynamics. Experimental values are given as mean ± SEM; n = 20 cells per timepoint, chosen from four different slides, cultured independently
Fig. 5
Fig. 5
Shape signals control maturation of vascular smooth muscle cells. a Representative images of SMCs plated on ellipsoid micropatterns and stained either for (left) α-SMA (green) and F-actin (red), or (right) calponin (green) and F-actin (red). In untreated SMCs, both α-SMA and calponin showed increased expression with increasing aspect ratio that was colocalized with actin stress fibers, which is a hallmark of contractile SMC maturation. When integrin β3 activation was blocked, this phenotypic feature was abolished. Treated cells with β1 blocking antibodies had no effect on the shape-driven phenotype even though the cells failed to comply with the ellipsoid micropatterns. b Quantitative analysis of α-SMA and calponin in SMCs plated on ellipsoid patterns with or without integrin β1 or β3 blocking antibodies. Values are given as mean ± SEM; n = 80, chosen randomly from eight different slides cultured independently (^p < 0.05, *p < 0.01 vs. previous ratio; one-way ANOVA comparisons independent for each condition). c SMCs were treated with varying concentrations of blebbistatin from 0.1 to 100 μM for 12 h before fixation and stained for F-actin (red) and α-SMA (green). Both stress fiber integrity and compliance of the cells with the micropatterns decrease with increasing blebbistatin concentration; however, α-SMA expression shows little change with the increasing blebbistatin concentration
Fig. 6
Fig. 6
Integrin β3 acts through ezrin–radixin–moesin (ERM) family to transduce shape signals. a Dendrogram depicting the preferential binding partners of β1 and β3 as characterized by mass spectrometry. Cell lysates from kidney podocytes were immunoprecipitated (IP) using monoclonal antibodies for the respective integrin isoforms and ran through label-free proteomics and quantified using the spectral counting method. Intensity represents the number of spectra per protein. ERM proteins merlin (NF2) and moesin (MSN) clustered as top differentially bound proteins for integrin β3. b Enrichment analysis using NCI-Nature ontological database showed “Beta1 integrin cell surface interactions” and “Beta3 integrin cell surface interactions” as the highest over-represented processes for the binding partners of the respective proteins. Color-coded bars represent the shown –log10 p value of respective enriched processes. c Representative images of podocytes plated on channel micropatterns and transfected with moesin (MSN), merlin (NF2), or scrambled siRNA, and stained for F-actin (red) and nephrin (green). d Quantitative analysis of (left) whole-cell nephrin intensity and (right) nephrin localization in processes of podocytes plated on channel micropatterns and transfected with scrambled, NF2, or MSN siRNA. Values given as mean ± SEM; n = 80, chosen randomly from four different slides cultured independently (*p < 0.01 vs. untreated control; one-way ANOVA followed by a post hoc Tukey test)
Fig. 7
Fig. 7
Intracellular reaction-diffusion dynamics enable shape sensing. a Schematic of the signaling pathway with an ERM-centered positive feedback loop that induces shape-based subcellular localization of proteins in podocytes. b (Top) Simulation results for nephrin localization in 3-D podocytes with peripheral processes of different widths. PDE-based dynamical models confirm the experimentally observed width-dependent localization of nephrin due to spatially heterogeneous focal adhesion assembly. (Bottom) Correlation between experimental localization of slit diaphragm proteins nephrin, podocin, and neph1 and the computational predictions. c The effect of experimentally measured molecular attributes of integrin β3 on generation and maintenance of localization phenotype was tested by removing individual molecular properties of integrin β3 and replacing them with those of integrin β1

Similar articles

Cited by

References

    1. Vogel V, Sheetz M. Local force and geometry sensing regulate cell functions. Nat. Rev. Mol. Cell Biol. 2006;7:265–275. doi: 10.1038/nrm1890. - DOI - PubMed
    1. Iskratsch T, Wolfenson H, Sheetz MP. Appreciating force and shape - the rise of mechanotransduction in cell biology. Nat. Rev. Mol. Cell Biol. 2014;15:825–833. doi: 10.1038/nrm3903. - DOI - PMC - PubMed
    1. McBeath R, Pirone DM, Nelson CM, Bhadriraju K, Chen CS. Cell shape, cytoskeletal tension, and RhoA regulate stem cell lineage commitment. Dev. Cell. 2004;6:483–495. doi: 10.1016/S1534-5807(04)00075-9. - DOI - PubMed
    1. Pollard TD, Cooper JA. Actin, a central player in cell shape and movement. Science. 2009;326:1208–1212. doi: 10.1126/science.1175862. - DOI - PMC - PubMed
    1. Kilian KA, Bugarija B, Lahn BT, Mrksich M. Geometric cues for directing the differentiation of mesenchymal stem cells. Proc. Natl. Acad. Sci. 2010;107:4872–4877. doi: 10.1073/pnas.0903269107. - DOI - PMC - PubMed

Publication types

MeSH terms