. 2017 Dec 15;7(1):17652.
doi: 10.1038/s41598-017-17389-9.

Lipidomics Reveals Cerebrospinal-Fluid Signatures of ALS

Affiliations

Lipidomics Reveals Cerebrospinal-Fluid Signatures of ALS

H Blasco et al. Sci Rep. .

Abstract

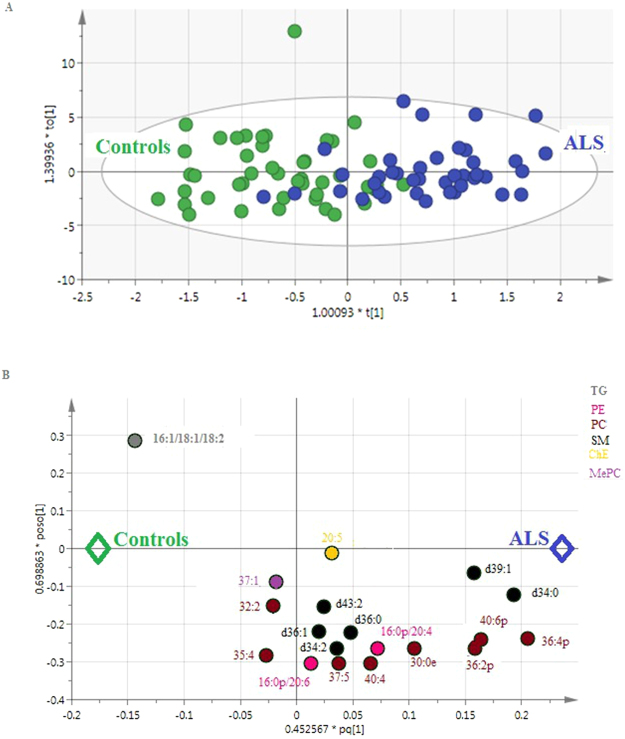
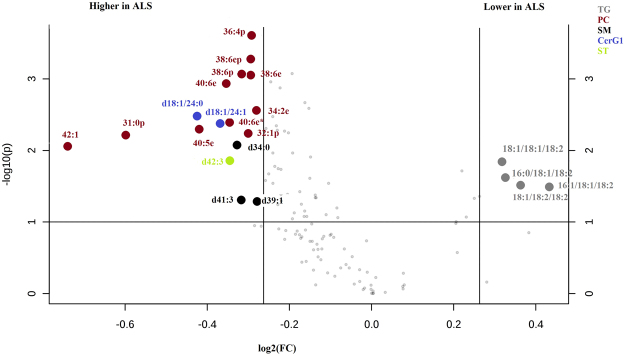
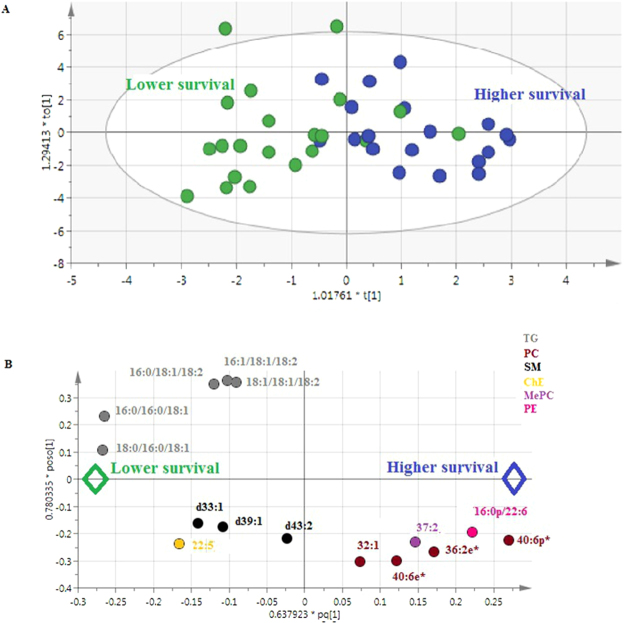
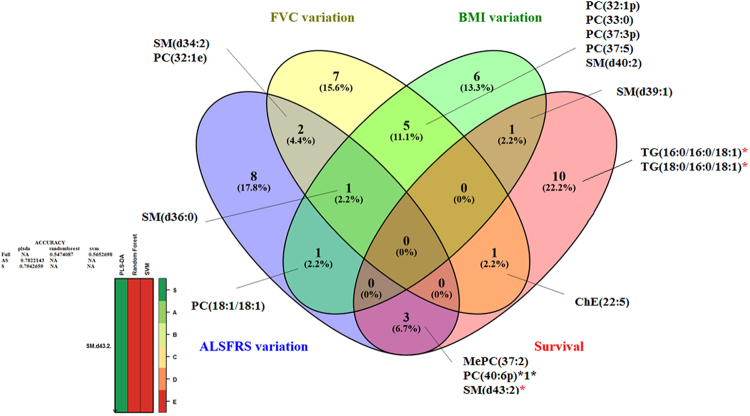
Amyotrophic lateral sclerosis (ALS), the commonest adult-onset motor neuron disorder, is characterized by a survival span of only 2-5 years after onset. Relevant biomarkers or specific metabolic signatures would provide powerful tools for the management of ALS. The main objective of this study was to investigate the cerebrospinal fluid (CSF) lipidomic signature of ALS patients by mass spectrometry to evaluate the diagnostic and predictive values of the profile. We showed that ALS patients (n = 40) displayed a highly significant specific CSF lipidomic signature compared to controls (n = 45). Phosphatidylcholine PC(36:4), higher in ALS patients (p = 0.0003) was the most discriminant molecule, and ceramides and glucosylceramides were also highly relevant. Analysis of targeted lipids in the brain cortex of ALS model mice confirmed the role of some discriminant lipids such as PC. We also obtained good models for predicting the variation of the ALSFRS-r score from the lipidome baseline, with an accuracy of 71% in an independent set of patients. Significant predictions of clinical evolution were found to be correlated to sphingomyelins and triglycerides with long-chain fatty acids. Our study, which shows extensive lipid remodelling in the CSF of ALS patients, provides a new metabolic signature of the disease and its evolution with good predictive performance.


Conflict of interest statement

The authors declare that they have no competing interests.

Figures

Figure 1
Figure 1
Multivariate analysis (OPLS-DA) of CSF lipids in patients with ALS and controls (n = 85) based on 19 lipids (p = 0.005). (A) Score scatter plot. Blue dots: patients with ALS; green dots: controls. X-axis and Y-axis represent score vectors summarizing all the variables entering the analysis: t1 and to1; R 2 X(cum) = 86.8% R 2 Y(cum) = 59.0%, Q 2(cum) = 0.402 (B) Loading scatter plot. Variables near each other are positively correlated; variables opposite to each other are negatively correlated. Variables closer to dots corresponding to “ALS” or “Controls” dots (i.e. with the largest absolute loading values) are higher in the corresponding populations. Lipids from the same family are represented with the same color.
Figure 2
Figure 2
Volcano plot (Metaboanalyst) of the CSF lipids of ALS patients and controls (n = 85), revealing 21 lipids with a p-value < 0.1 and a fold change >1.2. Lipids from the same family are represented with the same color.X-axis corresponds to log2(Fold Change) and Y-axis to −log10(p-value).
Figure 3
Figure 3
Multivariate analysis (OPLS-DA) of CSF lipids from patients with ALS (n = 40) revealed 16 lipids involved in survival. (A) Score scatter plot. Blue dots: ALS patients with survival > median; green dots: ALS patients with survival < median. X-axis and Y-axis represent score vectors summarizing all the variables entering the analysis: t1 and to1 (B) Loading scatter plot. Variables near each other are positively correlated; variables opposite to each other are negatively correlated. Variables closer to dots corresponding to “higher survival” or “lower survival” (i.e. with the largest absolute loading values) are higher in the corresponding populations. Lipids from the same family are represented with the same color.
Figure 4
Figure 4
Venn diagram constructed for the lipids highlighted by multivariate analysis (OPLS-DA using SIMCA®) to discriminate between ALS patients according to the modification of ALSFRS-r score, FVC, BMI over one year, and survival. The lipid marked with an asterisk (*), i.e. SM(d43:2), was also highlighted by the biosigner analysis, the results of which are shown at the bottom of the figure. The volcano plot shows the lipids with significantly higher levels in cases of ALS, i.e. PC(40:6p) and MePC(Monoetherphosphatidylcholine)(37:2), associated with better survival; SM(d43:2), associated with a lesser decline of the ALSFRS-r score; and SM(d36:0), associated a lesser decline of the FVC. The volcano plot also shows the lipids with significantly lower levels in cases of ALS, i.e. TG(16:0/16:0/18:1) and TG(18:0/16:0/18:1), associated with better survival; and SM(d40:2), SM(d39:1), PC(37:3p) and PC(32:1p), associated with a lesser decline of the BMI.

References

    1. Mitsumoto, H., Brooks, B. R. & Silani, V. Clinical trials in amyotrophic lateral sclerosis: why so many negative trials and how can trials be improved? Lancet Neurol13, 1127–1138, doi:S1474-4422(14)70129-2 (2014). - PubMed
    1. Dupuis L, et al. Dyslipidemia is a protective factor in amyotrophic lateral sclerosis. Neurology. 2008;70:1004–1009. doi: 10.1212/01.wnl.0000285080.70324.27. - DOI - PubMed
    1. Fergani A, et al. Increased peripheral lipid clearance in an animal model of amyotrophic lateral sclerosis. J Lipid Res. 2007;48:1571–1580. doi: 10.1194/jlr.M700017-JLR200. - DOI - PMC - PubMed
    1. Fonteh AN, Fisher RD. Combining lipidomics and proteomics of human cerebrospinal fluids. Methods Mol Biol. 2009;579:71–86. doi: 10.1007/978-1-60761-322-0_4. - DOI - PubMed
    1. Lauwers E, Goodchild R, Verstreken P. Membrane Lipids in Presynaptic Function and Disease. Neuron. 2016;90:11–25. doi: 10.1016/j.neuron.2016.02.033. - DOI - PubMed

Publication types

MeSH terms