. 2017 Dec 15;7(1):17661.
doi: 10.1038/s41598-017-17546-0.

Connectome-harmonic decomposition of human brain activity reveals dynamical repertoire re-organization under LSD

Affiliations

Connectome-harmonic decomposition of human brain activity reveals dynamical repertoire re-organization under LSD

Selen Atasoy et al. Sci Rep. .

Abstract

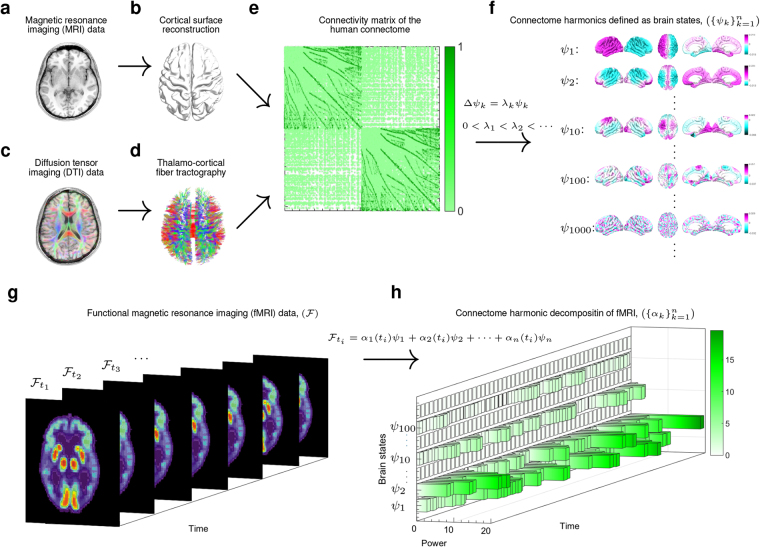
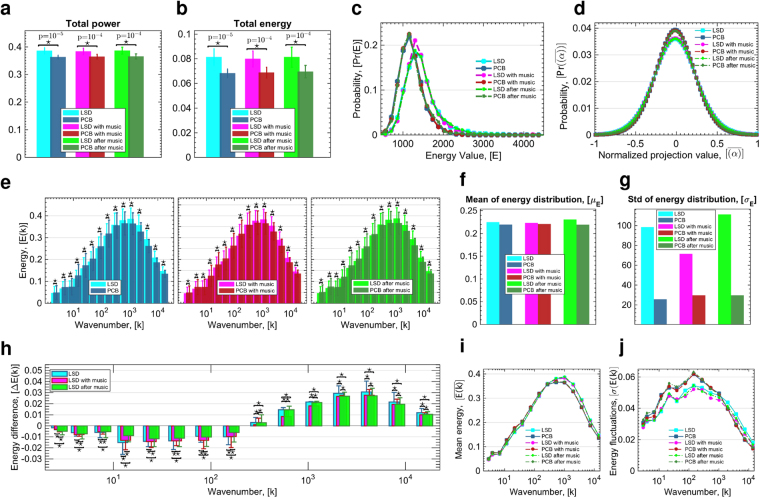
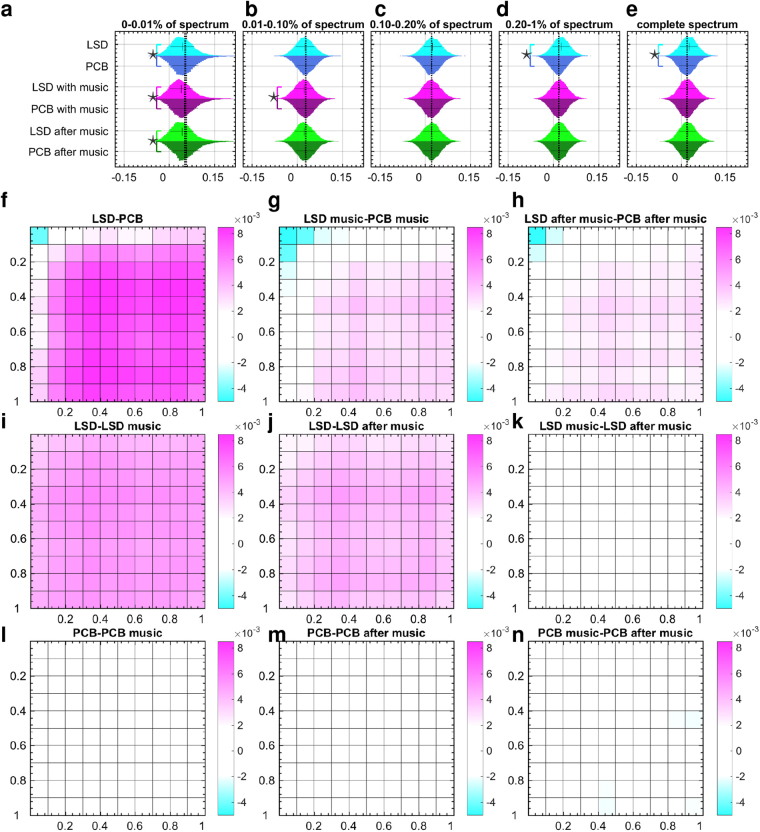
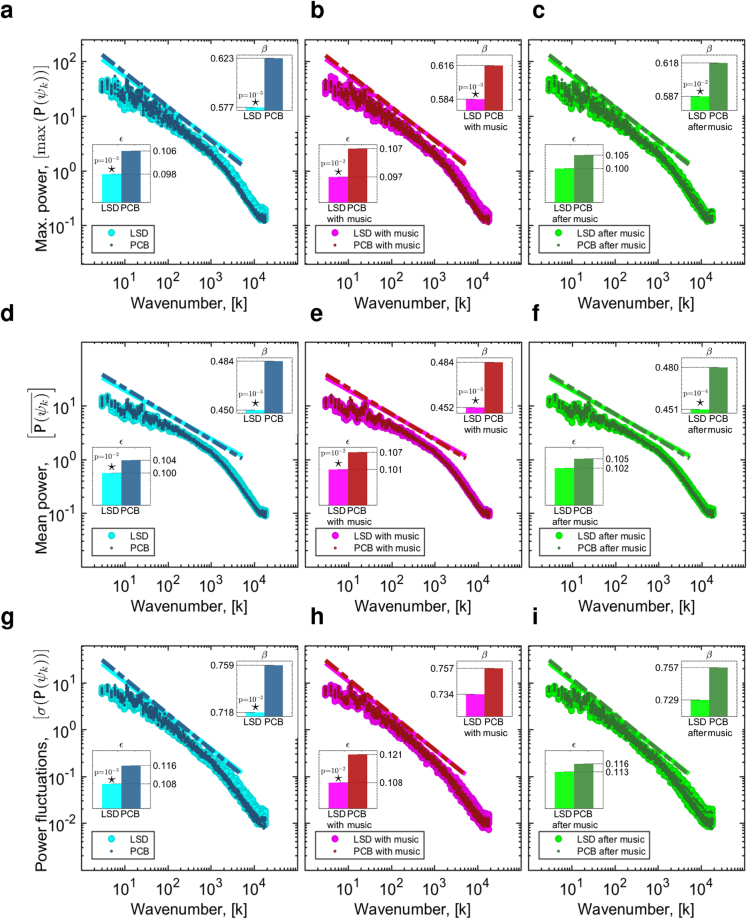
Recent studies have started to elucidate the effects of lysergic acid diethylamide (LSD) on the human brain but the underlying dynamics are not yet fully understood. Here we used 'connectome-harmonic decomposition', a novel method to investigate the dynamical changes in brain states. We found that LSD alters the energy and the power of individual harmonic brain states in a frequency-selective manner. Remarkably, this leads to an expansion of the repertoire of active brain states, suggestive of a general re-organization of brain dynamics given the non-random increase in co-activation across frequencies. Interestingly, the frequency distribution of the active repertoire of brain states under LSD closely follows power-laws indicating a re-organization of the dynamics at the edge of criticality. Beyond the present findings, these methods open up for a better understanding of the complex brain dynamics in health and disease.


Conflict of interest statement

The authors declare that they have no competing interests.

Figures

Figure 1
Figure 1
Illustration of the workflow. T1 magnetic resonance imaging (MRI) data (a) is used to reconstruct the cortical surface between gray and white matter as shown in (b). Diffusion tensor imaging (DTI) data (c) is used to extract thalamo-cortical fibers using deterministic fiber tractography as shown in (d). Both, local and long-distance connections are combined to create the connectivity matrix of the human connectome as illustrated in (e). Connectome harmonics ({ψk}k=1n) (f) are estimated by applying the Laplace operator Δ to human connectome and computing its eigenvectors (Δψ k = λ k ψ k). Functional magnetic resonance imaging (fMRI) data () as illustrated in (g) is decomposed in to the activation of connectome harmonics ({ψk}k=1n) yielding the power of activation of each of these brain states for each time instance ({αk}k=1n) as delineated in (h).
Figure 2
Figure 2
Changes in energy of brain states under LSD. Total power (a) and total energy (b) of all harmonic brain states for all 6 conditions, where stars indicate significant differences (p < 10−4, two-sample t-test) between each pair of LSD vs. PCB conditions with indicated p-values. (c) Probability distribution of total energy values (sum over all harmonics) for all 6 conditions. (d) Probability distribution of the occurrence of projection values (the amount of contribution) of connectome harmonics after normalization of each harmonic’s contribution by the maximum value of the baseline (PCB) condition, shown for all 6 conditions; LSD, PCB, LSD with-music, PCB with-music, LSD after-music, PCB after-music. (e) Energy of connectome harmonics quantized into 15 levels of wavenumbers k (in the log-scale) for conditions (left) LSD vs. PCB, (middle) LSD with-music vs. PCB with-music, (right) LSD after-music vs. PCB after-music. Stars indicate significant differences (p < 0.01, Monte-Carlo simulations after Bonferroni correction). (f) and (g) show the mean (μ) and standard deviation (σ) of the fit of the energy distribution of frequencies shown in (e) to normal distribution for all conditions, respectively. (h) shows the energy differences for each bin between the conditions LSD and PCB, LSD with-music and PCB with-music, LSD after-music and PCB after-music with stars indicating significant differences between conditions of no music, with music and after music (p < 0.01, Monte-Carlo simulations after Bonferroni correction). Mean (i) and standard deviation (j) of energy values of connectome harmonics ({ψk}k=1n) shown as a function of the wavenumber k.
Figure 3
Figure 3
Cross-frequency correlations. (ad) Distributions of cross-frequency correlation values within [0–0.01%], [0.01–0.1%], [0.1–0.2%] and [0.2–1%] of the spectrum, respectively. (e) Distribution of cross-frequency correlations across the complete spectrum of connectome harmonics. Significant differences between cross-frequency correlation distributions are marked with stars (effect size; Cohen’s d-value >0.2) for pairs of condition LSD, PCB, LSD with-music, PCB with-music, LSD after-music, PCB after-music. (fn) Illustrate differences in mean cross-frequency correlations in 10 × 10 partitions across the complete spectrum of connectome harmonics evaluated between all pairs of 6 condition; LSD, PCB, LSD with-music, PCB with-music; LSD after-music, PCB after-music.
Figure 4
Figure 4
Power laws in connectome harmonic decomposition. Maximum power (max(P(ψi))) vs. wavenumber (k) of connectome harmonics ({ψk}k=1n) in log10 coordinates for (a) LSD vs. PCB, (b) LSD with-music vs. PCB with-music and (c) LSD after-music vs. PCB after-music, respectively. Mean power (P(ψk)¯)) vs. wavenumber (k) of connectome harmonics ({ψk}k=1n) in log10 coordinates for (d) LSD vs. PCB, (e) LSD with-music vs. PCB with-music and (f) LSD after-music vs. PCB after-music, respectively. Power fluctuations (σ(P(ψ k))) vs. wavenumber (k) of connectome harmonics ({ψk}k=1n) in log10 coordinates for all 6 conditions. In all plots, ε and β indicate the root mean squared error and the slope of the line fit, respectively. Stars indicate significant differences (p < 0.05, two-sample t-test).
Figure 5
Figure 5
Correlations between energy changes of connectome harmonics and subjective experiences. (a) and (b) demonstrate significant correlations between the difference in mean energy of connectome harmonics Δ(E¯PCBE¯LSD) for low frequency connectome harmonics k = [1, …, 200] and the subjective ratings of ego dissolution and emotional arousal, respectively. (c) shows the correlation between the energy difference of connectome harmonics Δ(E¯PCB(E¯LSD) or a broader frequency range of connectome harmonics k = [1, …, 1100] and the subjective ratings of positive mood. (d) and (e) demonstrate significant correlations between the difference in energy fluctuations of connectome harmonics Δ(σ(EPCB) − σ(ELSD)) for low frequency connectome harmonics k = [1, …, 200] and the subjective ratings of ego dissolution and emotional arousal, respectively. (f) shows the correlation between difference in energy fluctuations of connectome harmonics Δ(σ(EPCB) − σ((ELSD)) for k = [1, …, 1100] and the subjective ratings of positive mood. (g) Illustrates multiple correlations between the functional connectivity changes of groups of resting state networks (RSNs) and subjective experiences estimated using 200 brain states, k = [1, …, 200] * p < 10−10, ** p < 10−15 after Bonferroni correction. Correlation strengths are represented by the intensity of red for each pair.

References

    1. Condrau G. Personality development in dystrophy of genital adiposity. Helvetica paediatrica acta. 1949;4:415. - PubMed
    1. Busch AK, Johnson WC. Lsd 25 as an aid in psychotherapy; preliminary report of a new drug. Diseases of the nervous system. 1950;11:241–243. - PubMed
    1. Huxley, A. The Doors of Perception.[On the Author’s Sensations Under the Influence of the Drug Mescalin.]. (Chatto & Windus, 1954).
    1. Savage C, Cholden L. Schizophrenia and the model psychoses. J. Clin. & Exper. Psychopath. 1956;17:405–412. - PubMed
    1. Abramson, H. A. The use of LSD in psychotherapy and alcoholism (Bobbs-Merrill, 1967).

Publication types