. 2017 Dec 15;7(1):17665.
doi: 10.1038/s41598-017-17751-x.

The transcriptome of Mycobacterium tuberculosis in a lipid-rich dormancy model through RNAseq analysis

Affiliations

The transcriptome of Mycobacterium tuberculosis in a lipid-rich dormancy model through RNAseq analysis

Diana A Aguilar-Ayala et al. Sci Rep. .

Abstract

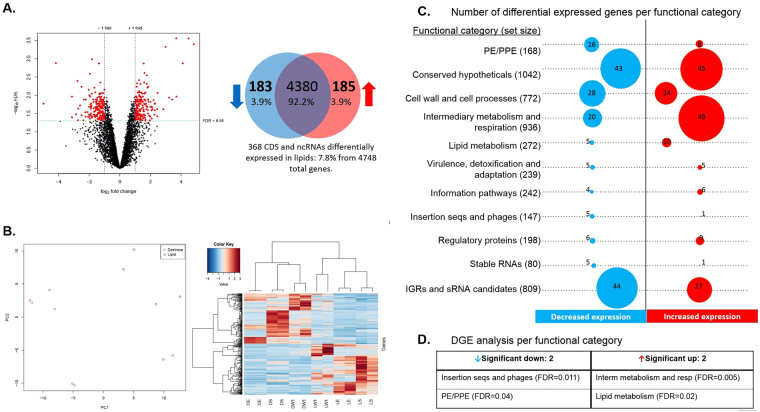
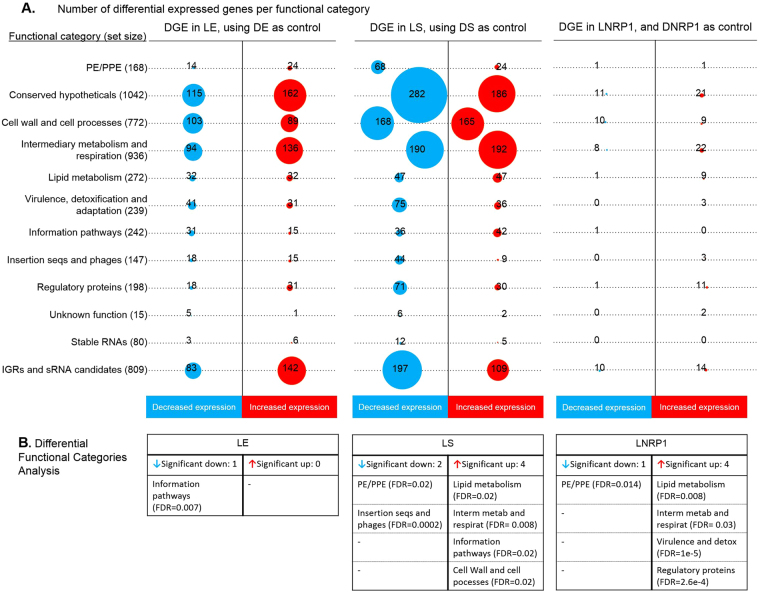
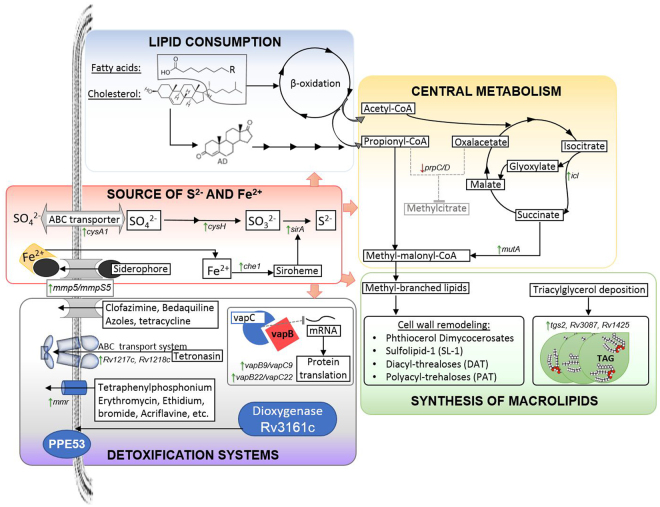
Tuberculosis (TB) is currently the number one killer among infectious diseases worldwide. Lipids are abundant molecules during the infectious cycle of Mycobacterium tuberculosis (Mtb) and studies better mimicking its actual metabolic state during pathogenesis are needed. Though most studies have focused on the mycobacterial lipid metabolism under standard culture conditions, little is known about the transcriptome of Mtb in a lipid environment. Here we determined the transcriptome of Mtb H37Rv in a lipid-rich environment (cholesterol and fatty acid) under aerobic and hypoxic conditions, using RNAseq. Lipids significantly induced the expression of 368 genes. A main core lipid response was observed involving efflux systems, iron caption and sulfur reduction. In co-expression with ncRNAs and other genes discussed below, may act coordinately to prepare the machinery conferring drug tolerance and increasing a persistent population. Our findings could be useful to tag relevant pathways for the development of new drugs, vaccines and new strategies to control TB.


Conflict of interest statement

The authors declare that they have no competing interests.

Figures

Figure 1
Figure 1
RNA-seq mapping results for every experimental condition and biological replicates. Sense and anti-sense mapping is figured in the chart (A). Grey bars show the reads mapped in the sense direction. Not mapped reads were mapped in the anti-sense direction and are represented by black bars. The chart (B) show stacked columns of total mapped reads in the sense direction. Gray bars with white dots show the percentage of reads aligned to ncRNA and light gray bars show the percentage of reads aligned to CDS. Detailed data of RNA-seq mapping can be seen in the Supplemental Material, Table S3.
Figure 2
Figure 2
Plots of the principal component analysis (A) and the clustering-heatmap (B) of all genes after normalization using edge R. For the PCA plot, the data was rlog transformed. For the clustering heatmap, normalized counts were rescaled between −3 and 3, clustering was based on Pearson correlation. The six experimental conditions clustered with their biological replicates.
Figure 3
Figure 3
Differential gene expression of Mtb H37Rv in presence of lipids. Conditions with dextrose were used as control and growth stages were used as batch effect. Counts were normalized using edge R, all genes with a CPM greater than 1 in at least 2 samples were used in the analysis. 368 significant differentially expressed genes were found. (A) Volcano plot (on the left) and its Venn diagram (on the right) where 185 genes with diminished expression and 183 genes with increased expression in presence of lipids are specified. (B) PCA and heatmap plots of the 368 differential expressed genes that were rescaled between −3 and 3, clustering was based on the Pearson correlation. (C) Number of differentially expressed genes by functional categories are shown, circle sizes are proportional to the number of genes with significant differential expression, total number of genes per functional category listed in tuberculist are indicated in parenthesis. (D) Differential functional categories analysis. Only significant expressed categories (FDR < 0.05) are indicated.
Figure 4
Figure 4
Differential gene expression of Mtb H37Rv in every stage of growth in presence of lipids. Dextrose conditions were used as controls. The heatmap and volcano plots are shown in figure (A) for the 1241 differentially expressed genes in LE, figure (B) shows the 2043 differentially expressed genes in LS and figure (C) shows the 138 differentially expressed genes in LNRP1. Normalized counts in the heatmap were rescaled between −3 and 3 with clustering based on Pearson correlation and differentially expressed genes were considered significant using a false discovery rate of <0.05 and a log2 fold change >1 or <−1.
Figure 5
Figure 5
Differential gene expression per functional categories of every stage of growth of Mtb. (A) The number of differentially expressed genes are shown by functional categories, where circle sizes are proportional to the number of genes with significant differential expression. Blue circles are used for genes with diminished expression and red circles are used for genes with increased expression. Total number of genes per functional category listed in tuberculist are indicated in parenthesis. (B) Differential functional Categories analysis are indicated in tables for every stage of growth, wherein the mean log2 fold change is significantly different from the general mean log2 fold change at a FDR <0.05.
Figure 6
Figure 6
Core of genes induced by the presence of lipids.
Figure 7
Figure 7
Validation of ten differential expressed genes in lipid conditions by qRT-PCR. (A) Absolute gene expression during DE (gray bars), LE (black bars), DS (light blue bars), LS (dark blue bars), DNRP1 (light green bars) and LNRP1 (dark green bars) conditions. Data were normalized to the number of copies of rrs gene and results are expressed as log10 of the mean ± SD number of copies per microgram of RNA. Asterisks indicate significant diference between a given lipid stage compared to its respective dextrose stage (LE vs DE, LS vs DS and LNRP1 vs DNRP1), with P < 0.05 considered statistically significant. (B) The relative quantification is expressed as the ratio of [transcription in LE/transcripion in DE] (black bars), the ratio of [transcription in LS/transcription in DS] (blue bars) and the ratio of [transcription in LNRP1/transcription in DNRP1] (green bars).
Figure 8
Figure 8
Correlated gene expression among PPE53, Rv3160c and Rv3161c. Plots show data reported by Boshoff and colleagues through microarray assay, which is deposited in the correlation catalog of the TBDB data base,. (A). Comparison between PPE53 and Rv3160c; (B). Comparison between PPE53 and Rv3161C; (C). Comparison between Rv3161c and Rv3161c. Black frames and circles highlight positive correlation between two genes in samples of Mycobacterium tuberculosis under diferent conditions. Gene expression responses of Mtb to 76 treatment groups are represseented by red dots. Plots resumed experimental categories: 1) samples of Mtb under inhibitors of cell wall synthesis (left), 2) samples of Mtb under diferent inhibitors of respiration (middle) and 3) “others” (on the right) inlcludes 8 categories more, such as acidified médium, agents that affect DNA integrty or topology, aromatic amides that can be hydrolyzed intracellylary, growth associated with dosR regulon, inhibitors of protein synthesis, minimal medium with palmitate or succinate as carbon, starvation and transcriptional inhibitors. It can be seen that PPE53, Rv3160c and Rv3161c are mainly co-expressed in compounds that affect cell wall synthesis and respiration. On the other hand, these genes are not induced by compounds from the cathegory “others”.
Figure 9
Figure 9
Correlated gene expression between Rv3161c and mmpL5. Plots show data reported by Boshoff and colleagues through microarray assay, which is deposited in the correlation catalog of the TBDB data base,. Black frames highlight positive correlation between Rv3161c and mmpL5 (>1 for both) in samples of Mycobacterium tuberculosis under diferent conditions. Gene expression responses of Mtb to 76 treatment groups are represseented by red dots. Plots resumed experimental categories: 1) samples of Mtb under inhibitors of cell wall synthesis (upper left), 2) samples of Mtb under diferent inhibitors of respiration (upper right), 3) in presence of aromatic amides (lower left) and 4) “others” (lower right) inlcludes 7 categories more, such as acidified médium, agents that affect DNA integrty or topology, growth associated with dosR regulon, inhibitors of protein synthesis, minimal medium with palmitate or succinate as carbon, starvation and transcriptional inhibitors. DCCD: Dicyclohexylcarbodiimide, TRZ: Thioridazine, CPZ: Chlorpromazine, CFZ: Clofazimine, KCN: Potassium cyanide, PZA: Pyrazinamide,. It can be seen that Rv3161c and mmpL5 are mainly co-expressed in compounds that affect cell wall synthesis and respiration as well as in presence of aromatic amides. Besides, these genes are not co-expressed by compounds from the cathegory “others”.
Figure 10
Figure 10
Principal metabolic pathways activated by the core lipid response.

References

    1. WHO. Global tuberculosis report 2016. Geneva: World Health Organization Available at: http://www.who.int/tb/about/ (2016).
    1. Leisching G, et al. The host response to a clinical MDR mycobacterial strain cultured in a detergent- free environment: A global transcriptomics approach. PLoS One. 2016;11:1–16. doi: 10.1371/journal.pone.0153079. - DOI - PMC - PubMed
    1. Soto-Ramirez MD, et al. Cholesterol plays a larger role during Mycobacterium tuberculosis in vitro dormancy and reactivation than previously suspected. Tuberculosis. 2017;103:1–9. doi: 10.1016/j.tube.2016.12.004. - DOI - PubMed
    1. Shleeva, M. et al. Cyclic AMP-dependent resuscitation of dormant mycobacteria by exogenous free fatty acids. PLoS One8, (2013). - PMC - PubMed
    1. Lovewell RR, Sassetti CM, VanderVen BC. Chewing the fat: lipid metabolism and homeostasis during M. tuberculosis infection. Curr. Opin. Microbiol. 2016;29:30–36. doi: 10.1016/j.mib.2015.10.002. - DOI - PubMed

Publication types

MeSH terms