

Real-time decoding of covert attention in higher-order visual areas
- PMID: 29247807
- PMCID: PMC5864512
- DOI: 10.1016/j.neuroimage.2017.12.019
Real-time decoding of covert attention in higher-order visual areas
Abstract
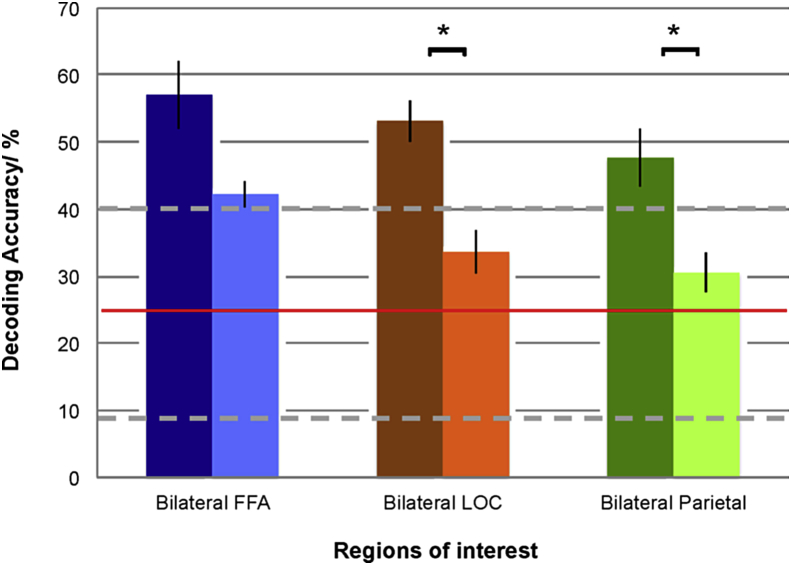
Brain-computer-interfaces (BCI) provide a means of using human brain activations to control devices for communication. Until now this has only been demonstrated in primary motor and sensory brain regions, using surgical implants or non-invasive neuroimaging techniques. Here, we provide proof-of-principle for the use of higher-order brain regions involved in complex cognitive processes such as attention. Using realtime fMRI, we implemented an online 'winner-takes-all approach' with quadrant-specific parameter estimates, to achieve single-block classification of brain activations. These were linked to the covert allocation of attention to real-world images presented at 4-quadrant locations. Accuracies in three target regions were significantly above chance, with individual decoding accuracies reaching upto 70%. By utilising higher order mental processes, 'cognitive BCIs' access varied and therefore more versatile information, potentially providing a platform for communication in patients who are unable to speak or move due to brain injury.
Copyright © 2017 The Authors. Published by Elsevier Inc. All rights reserved.
Figures


Similar articles
-
Navigation of a telepresence robot via covert visuospatial attention and real-time fMRI.Brain Topogr. 2013 Jan;26(1):177-85. doi: 10.1007/s10548-012-0252-z. Epub 2012 Sep 11. Brain Topogr. 2013. PMID: 22965825 Free PMC article.
-
Stimulus predictability has little impact on decoding of covert visual spatial attention.J Neural Eng. 2025 Jun 11;22(3). doi: 10.1088/1741-2552/addf81. J Neural Eng. 2025. PMID: 40456242
-
Real-time decoding of the direction of covert visuospatial attention.J Neural Eng. 2012 Aug;9(4):045004. doi: 10.1088/1741-2560/9/4/045004. Epub 2012 Jul 25. J Neural Eng. 2012. PMID: 22831959
-
Real-time fMRI for brain-computer interfacing.Handb Clin Neurol. 2020;168:289-302. doi: 10.1016/B978-0-444-63934-9.00021-4. Handb Clin Neurol. 2020. PMID: 32164860 Review.
-
Sources of spatial and feature-based attention in the human brain.J Neurosci. 2008 Sep 17;28(38):9328-9. doi: 10.1523/JNEUROSCI.3562-08.2008. J Neurosci. 2008. PMID: 18799666 Free PMC article. Review. No abstract available.
Cited by
-
Decoding the Temporal Dynamics of Covert Spatial Attention Using Multivariate EEG Analysis: Contributions of Raw Amplitude and Alpha Power.Front Hum Neurosci. 2020 Oct 9;14:570419. doi: 10.3389/fnhum.2020.570419. eCollection 2020. Front Hum Neurosci. 2020. PMID: 33192401 Free PMC article.
-
Modulating the interhemispheric activity balance in the intraparietal sulcus using real-time fMRI neurofeedback: Development and proof-of-concept.Neuroimage Clin. 2020;28:102513. doi: 10.1016/j.nicl.2020.102513. Epub 2020 Nov 27. Neuroimage Clin. 2020. PMID: 33396000 Free PMC article.
References
-
- Allison, B.Z., Wolpaw, E.W., Wolpaw, J.R., Wolpaw, W., 2007. Brain – computer interface systems : progress and prospects 463–474. - PubMed
-
- Andersson P., Viergever M.A., Pluim J.P.W., Ramsey N.F., Siero J.C.W. 2009 4th Int. IEEE/EMBS Conf. Neural Eng. 2009. fMRI based BCI control using spatial visual attention at 7T; pp. 444–446.
-
- Andersson P., Ramsey N.F., Pluim J.P.W., Viergever M.A. BCI control using 4 direction spatial visual attention and real-time fMRI at 7T. Conf. Proc. IEEE Eng. Med. Biol. Soc. 2010;2010:4221–4225. - PubMed
-
- Andersson P., Ramsey N.F., Raemaekers M., Viergever M.A., Pluim J.P.W. Real-time decoding of the direction of covert visuospatial attention. J. Neural. Eng. 2012;9:45004. - PubMed
MeSH terms
Grants and funding
LinkOut - more resources
Full Text Sources
Other Literature Sources
