

ECoG high-gamma modulation versus electrical stimulation for presurgical language mapping
- PMID: 29247963
- PMCID: PMC5815885
- DOI: 10.1016/j.yebeh.2017.10.044
ECoG high-gamma modulation versus electrical stimulation for presurgical language mapping
Abstract
Objective: This meta-analysis compared diagnostic validity of electrocorticographic (ECoG) high-γ modulation (HGM) with electrical stimulation mapping (ESM) for presurgical language localization.
Methods: From a structured literature search, studies with electrode level data comparing ECoG HGM and ESM for language localization were included in the meta-analysis. Outcomes included global measures of diagnostic validity: area under the summary receiver operating characteristic (SROC) curve (AUC), and diagnostic odds ratio (DOR); as well as pooled estimates of sensitivity and specificity. Clinical and technical determinants of sensitivity/specificity were explored.
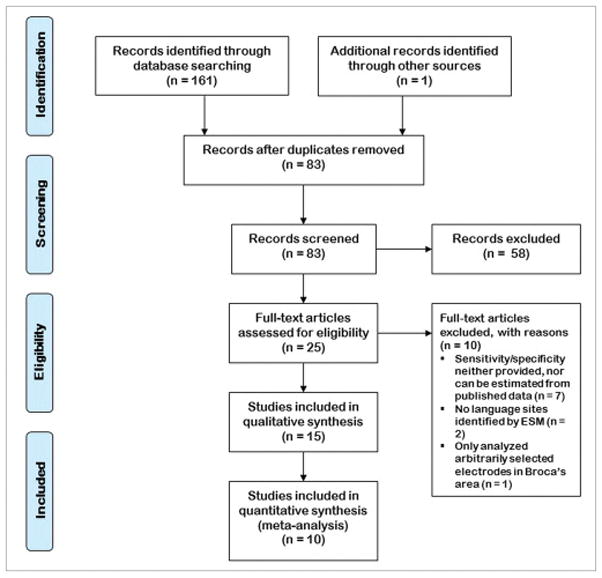
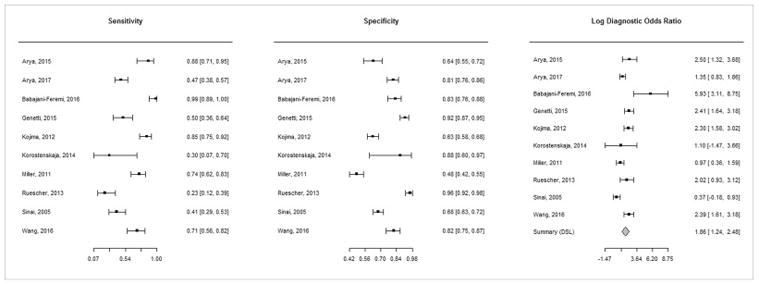
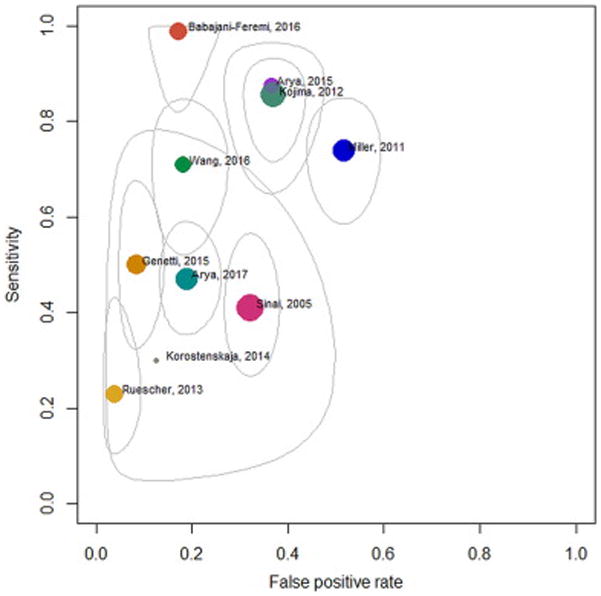
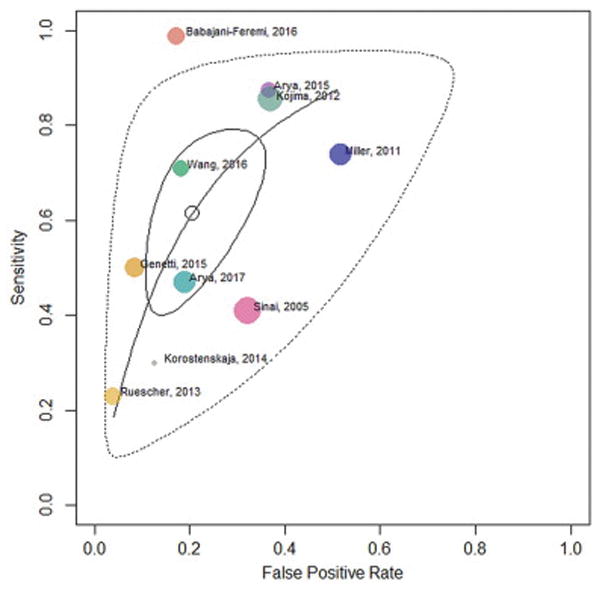
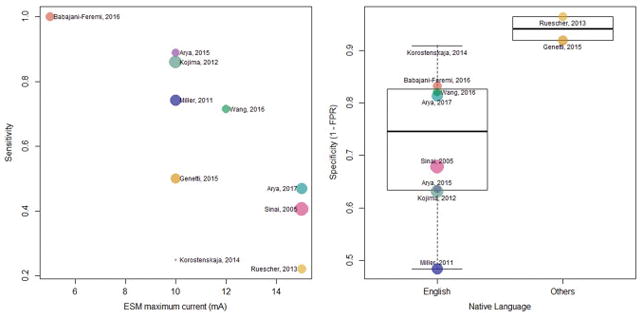
Results: Fifteen studies were included in qualitative synthesis, and 10 studies included in the meta-analysis (number of patients 1-17, mean age 10.3-53.6years). Overt picture naming was the most commonly used task for language mapping with either method. Electrocorticographic high-γ modulation was analyzed at 50-400Hz with different bandwidths in individual studies. For ESM, pulse duration, train duration, and maximum current varied greatly among studies. Sensitivity (0.23-0.99), specificity (0.48-0.96), and DOR (1.45-376.28) varied widely across studies. The pooled estimates are: sensitivity 0.61 (95% CI 0.44, 0.76), specificity 0.79 (95% CI 0.68, 0.88), and DOR 6.44 (95% CI 3.47, 11.94). Area under the SROC curve was 0.77. Results of bivariate meta-regression were limited by small samples for individual variables.
Conclusion: Electrocorticographic high-γ modulation is a specific but not sensitive method for language localization compared with gold-standard ESM. Given the pooled DOR of 6.44 and AUC of 0.77, ECoG HGM can fairly reliably ascertain electrodes overlying ESM cortical language sites.
Keywords: Epilepsy surgery; Functional brain mapping; Language localization.
Copyright © 2017 Elsevier Inc. All rights reserved.
Figures
Comment in
-
Electrocorticographic high gamma language mapping: Mind the pitfalls of comparison with electrocortical stimulation.Epilepsy Behav. 2018 May;82:196-199. doi: 10.1016/j.yebeh.2018.02.001. Epub 2018 Mar 7. Epilepsy Behav. 2018. PMID: 29525721 No abstract available.
-
Electrocorticographic high-gamma language mapping: Limitations of comparisons with electrocortical stimulation.Epilepsy Behav. 2018 May;82:200-201. doi: 10.1016/j.yebeh.2018.02.017. Epub 2018 Mar 22. Epilepsy Behav. 2018. PMID: 29576436 No abstract available.
References
-
- Jayakar P, Lesser RP. Extraoperative functional mapping. In: Engel JJ, Pedley TA, editors. Epilepsy: A comprehensive textbook. 2. Philadelphia, PA: Lippincott Williams & Wilkins; 2008. pp. 1851–1858.
-
- Aungaroon G, Zea Vera A, Horn PS, Byars AW, Greiner HM, Tenney JR, Arthur TM, Crone NE, Holland KD, Mangano FT, Arya R. After-discharges and seizures during pediatric extra-operative electrical cortical stimulation functional brain mapping: Incidence, thresholds, and determinants. Clin Neurophysiol. 2017;128:2078–2086. - PubMed
-
- Zea Vera A, Aungaroon G, Horn PS, Byars AW, Greiner HM, Tenney JR, Arthur TM, Crone NE, Holland KD, Mangano FT, Arya R. Language and motor function thresholds during pediatric extra-operative electrical cortical stimulation brain mapping. Clin Neurophysiol. 2017;128:2087–2093. - PubMed
-
- Hamberger MJ. Cortical language mapping in epilepsy: a critical review. Neuropsychol Rev. 2007;17:477–89. - PubMed
-
- Crone NE, Sinai A, Korzeniewska A. High-frequency gamma oscillations and human brain mapping with electrocorticography. Prog Brain Res. 2006;159:275–95. - PubMed
Publication types
MeSH terms
Grants and funding
LinkOut - more resources
Full Text Sources
Other Literature Sources
