. 2018 Mar;188(3):600-615.
doi: 10.1016/j.ajpath.2017.11.016. Epub 2017 Dec 15.

Knockout of l-Histidine Decarboxylase Prevents Cholangiocyte Damage and Hepatic Fibrosis in Mice Subjected to High-Fat Diet Feeding via Disrupted Histamine/Leptin Signaling

Affiliations

Knockout of l-Histidine Decarboxylase Prevents Cholangiocyte Damage and Hepatic Fibrosis in Mice Subjected to High-Fat Diet Feeding via Disrupted Histamine/Leptin Signaling

Lindsey Kennedy et al. Am J Pathol. 2018 Mar.

Abstract

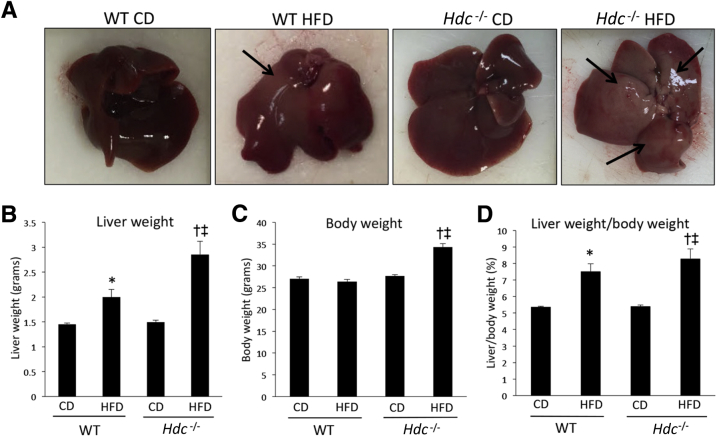
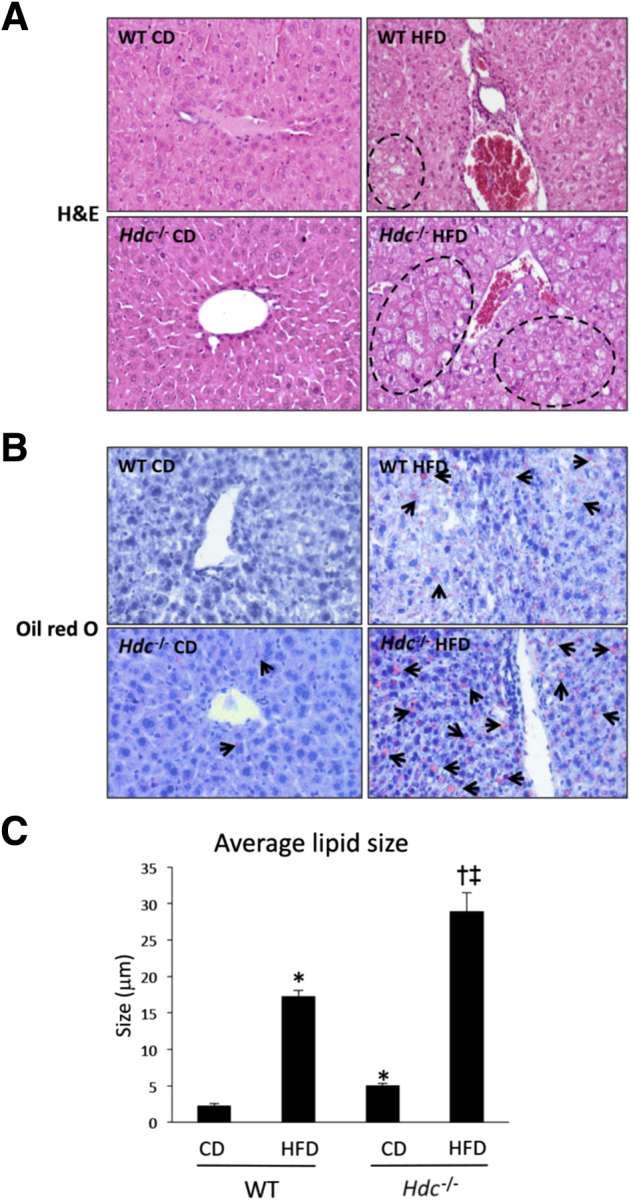
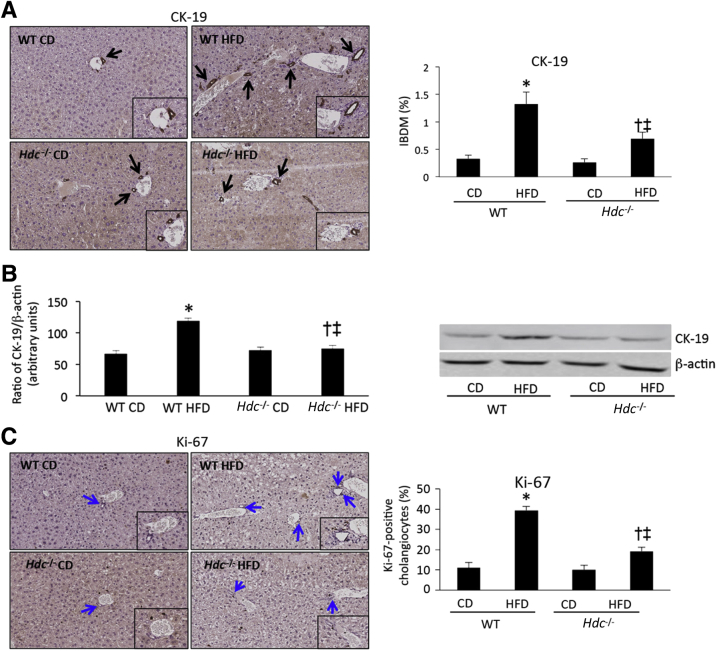
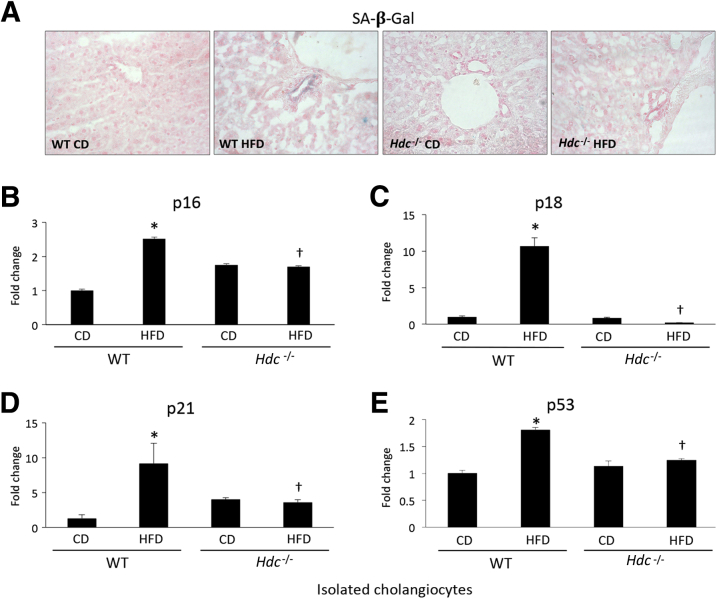
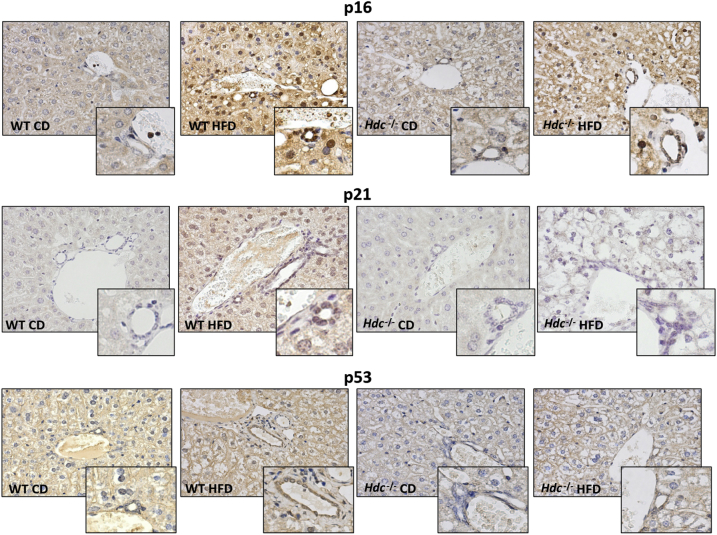
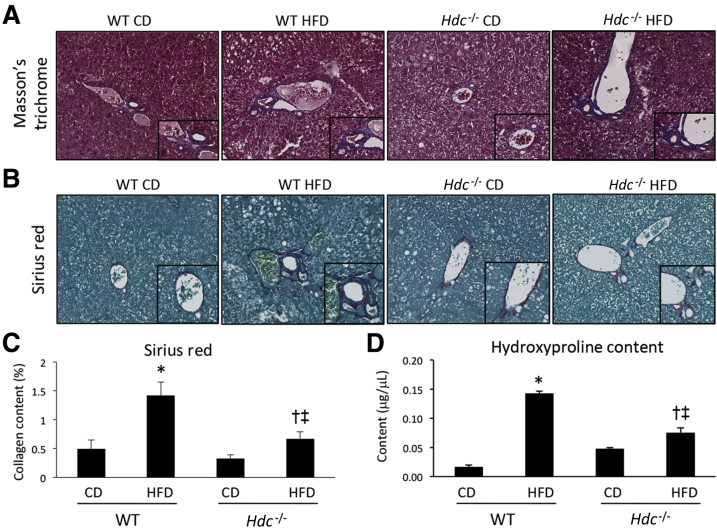
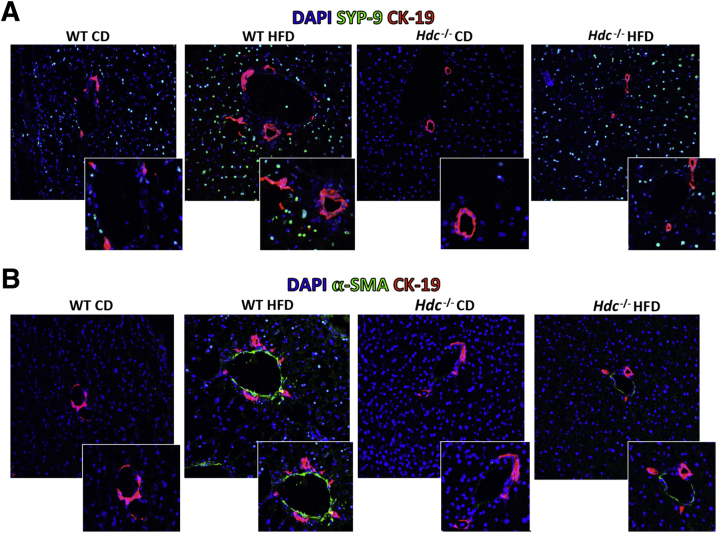
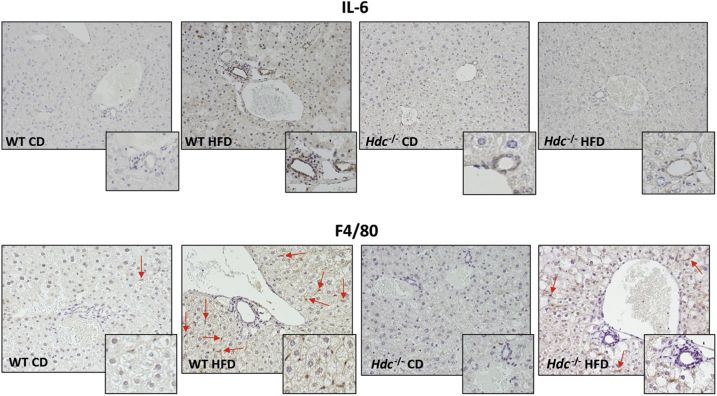
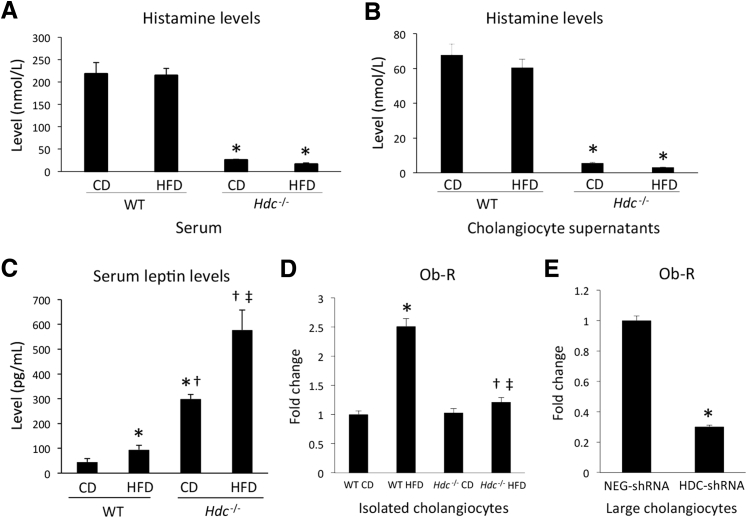
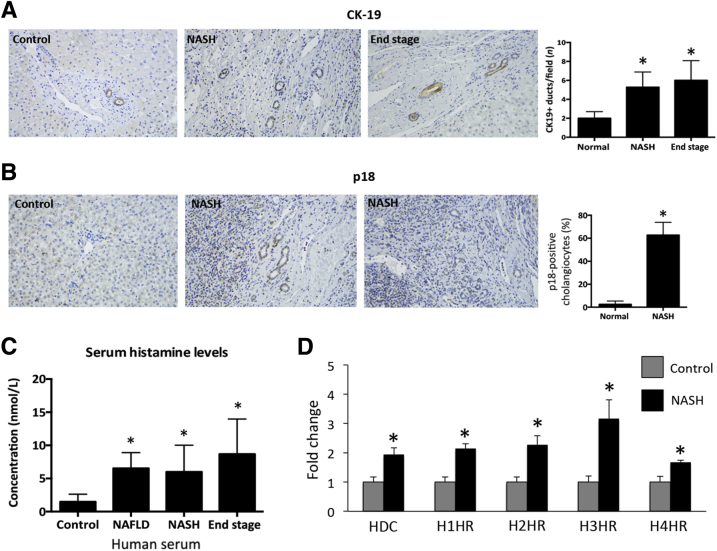
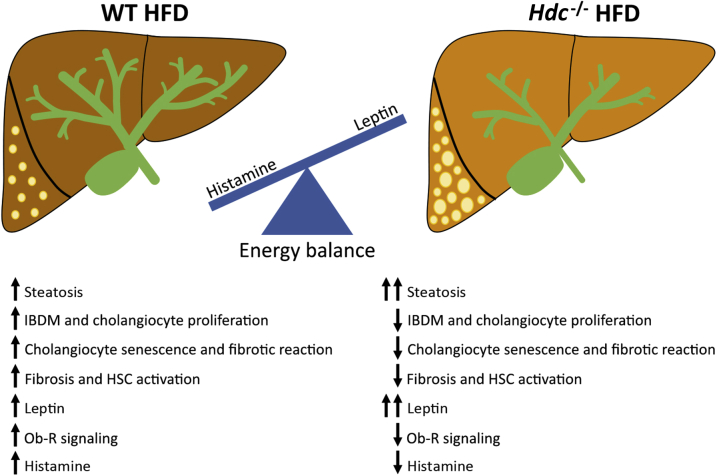
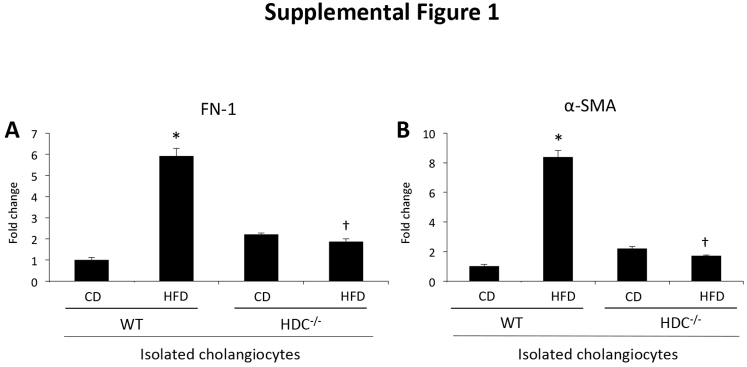
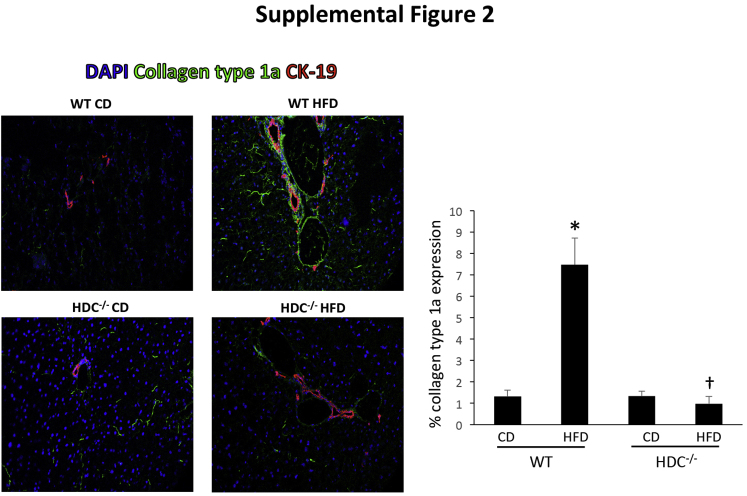
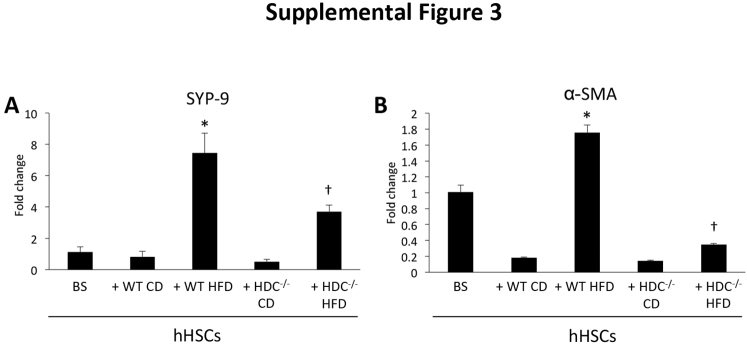
Feeding a high-fat diet (HFD) coupled with sugar, mimicking a Western diet, causes fatty liver disease in mice. Histamine induces biliary proliferation and fibrosis and regulates leptin signaling. Wild-type (WT) and l-histidine decarboxylase (Hdc-/-) mice were fed a control diet or an HFD coupled with a high fructose corn syrup equivalent. Hematoxylin and eosin and Oil Red O staining were performed to determine steatosis. Biliary mass and cholangiocyte proliferation were evaluated by immunohistochemistry. Senescence and fibrosis were measured by quantitative PCR and immunohistochemistry. Hepatic stellate cell activation was detected by immunofluorescence. Histamine and leptin levels were measured by enzyme immunoassay. Leptin receptor (Ob-R) was evaluated by quantitative PCR. The HDC/histamine/histamine receptor axis, ductular reaction, and biliary senescence were evaluated in patients with nonalcoholic fatty liver disease, nonalcoholic steatohepatitis, or end-stage liver disease. Hdc-/- HFD mice had increased steatosis compared with WT HFD mice. WT HFD mice had increased biliary mass, biliary proliferation, senescence, fibrosis, and hepatic stellate cell activation, which were reduced in Hdc-/- HFD mice. In Hdc-/- HFD mice, serum leptin levels increased, whereas biliary Ob-R expression decreased. Nonalcoholic steatohepatitis patients had increased HDC/histamine/histamine receptor signaling. Hdc-/- HFD mice are susceptible to obesity via dysregulated leptin/Ob-R signaling, whereas the lack of HDC protects from HFD-induced fibrosis and cholangiocyte damage. HDC/histamine/leptin signaling may be important in managing obesity-induced biliary damage.


Figures

Figure 1
Figure 1
Macroscopic changes and evaluation of liver weight, body weight, and ratios after high-fat diet (HFD) feeding. A: WT HFD mice show increased macroscopic changes associated with hepatic steatosis development (arrows) when compared with WT control diet (CD) mice; however, these changes are further increased in Hdc−/− HFD mice when compared with WT HFD mice. B: WT HFD mice have increased liver weight compared with WT CD mice, and this is further increased in Hdc−/− HFD mice compared with WT HFD mice. C: Body weight is unhanged between WT CD, Hdc−/− CD, and WT HFD mice, but is significantly increased in Hdc−/− HFD mice when compared with WT HFD mice. D: Liver/body weight ratio is increased in WT HFD compared with WT CD mice, and is further increased in Hdc−/− HFD mice when compared with WT HFD mice. Data are expressed as means ± SEM. n = 6 mice (BD). P < 0.05 versus WT CD; P < 0.05 versus WT HFD; P < 0.05 versus Hdc−/− CD.
Figure 2
Figure 2
Changes in hepatic steatosis, hepatocyte ballooning, and hepatic lipid droplet number and size after high-fat diet (HFD) feeding. A: As demonstrated by hematoxylin and eosin (H&E) staining, WT HFD mice displayed increased hepatic steatosis and hepatocyte ballooning (dashed lines) when compared with WT control diet (CD) mice, and these parameters were further increased in Hdc−/− HFD mice when compared with WT HFD mice. B: As demonstrated by Oil Red O staining, WT HFD mice have an increased number of lipid droplets (arrows) when compared with WT CD mice, and this is exacerbated in Hdc−/− HFD mice when compared with WT HFD mice. Similarly, WT HFD mice have increased average lipid droplet size when compared with WT CD mice, and this is further increased in Hdc−/− HFD mice when compared with WT HFD mice. C:Hdc−/− CD mice have a few lipid droplets, as shown by Oil Red O staining, and slightly increased average lipid droplet size when compared with WT CD mice. Data are expressed as means ± SEM (C). n = 10 images (A and B). P < 0.05 versus WT CD; P < 0.05 versus WT HFD; P < 0.05 versus Hdc−/−CD. Original magnification, ×20 (A and B).
Figure 3
Figure 3
Quantification of biliary damage after high-fat diet (HFD) feeding. A: As demonstrated by immunohistochemistry for cytokeratin-19 (CK-19; black arrows), WT HFD mice have increased intrahepatic biliary mass (IBDM) when compared with WT control diet (CD) mice; however, IBDM is significantly decreased in Hdc−/− HFD mice when compared with WT HFD mice. Insets: Magnified images showing proliferating cholangiocytes. B: By immunoblotting for CK-19, protein expression increased in WT HFD mice compared with WT CD mice, and this was reduced in the Hdc−/− HFD mice. Insets: Magnified images showing CK-19-positive bile ducts. C: As shown by immunohistochemistry for Ki-67 (blue arrows), WT HFD mice have increased cholangiocyte proliferation when compared with WT CD mice; however, Hdc−/− HFD mice have significantly decreased cholangiocyte proliferation when compared with WT HFD mice. Data are expressed as means ± SEM (AC). n = 10 images for CK-19 and Ki-67 immunohistochemistry and 10 immunoblots (AC). P < 0.05 versus WT CD; P < 0.05 versus WT HFD; P < 0.05 versus Hdc−/− CD. Original magnification: ×20 (A and C, main images); ×40 (A and C, insets).
Figure 4
Figure 4
Determination of cholangiocyte senescence after high-fat diet (HFD) feeding. A: As shown by senescence-associated-β-galactosidase (SA-β-Gal) staining, increased biliary senescence in WT HFD mice is observed, which is reduced in Hdc−/− HFD mice. BE: By real-time quantitative PCR (qPCR), cholangiocytes isolated from WT HFD mice have increased expression of the senescent markers cyclin-dependent kinase inhibitor 2A (p16), cyclin-dependent kinase 4 inhibitor (p18), cyclin-dependent kinase 1 inhibitor (p21), and tumor suppressor p53d when compared with WT control diet (CD) mice; however, these parameters are decreased in cholangiocytes isolated from Hdc−/− HFD mice when compared with WT HFD mice. Data are expressed as means ± SEM (BE). n ≥ 3 reactions in triplicate for qPCR (BE). P < 0.05 versus WT CD; P < 0.05 versus WT HFD. Original magnification, ×20 (A).
Figure 5
Figure 5
Evaluation of cholangiocyte senescence by immunohistochemistry. The expression of cyclin-dependent kinase inhibitor 2A (p16), cyclin-dependent kinase 1 inhibitor (p21), and tumor suppressor p53 is up-regulated in cholangiocytes in WT high-fat diet (HFD) mice compared with WT control diet (CD) mice. Cholangiocyte senescence decreases in Hdc−/− HFD mice compared with WT HFD. Insets: Magnified images showing senescent cholangiocytes. Original magnification: ×20 (main images); ×40 (insets).
Figure 6
Figure 6
Determination of hepatic fibrosis after high-fat diet (HFD) feeding. AC: As demonstrated by Masson's trichrome and Sirius Red staining (A and B) and Sirius Red staining semiquantification (C), WT HFD mice show increased collagen deposition when compared with WT control diet (CD) mice; however, Hdc−/− HFD mice show a decreased amount of collagen deposition when compared with WT HFD mice. D: As evaluated by hydroxyproline assay, WT HFD mice show increased hydroxyproline content when compared with WT CD mice; however, Hdc−/− HFD mice show decreased hydroxyproline content when compared with WT HFD mice. Data are expressed as means ± SEM (C and D). n = 10 images for Sirius Red semiquantification (C); n = 6 reactions for hydroxyproline assay (D). P < 0.05 versus WT CD; P < 0.05 versus WT HFD; P < 0.05 versus Hdc−/− CD. Original magnification: ×20 (A and B, main images); ×40 (A and B, insets).
Figure 7
Figure 7
Evaluation of hepatic stellate cell (HSC) activation after high-fat diet (HFD) feeding. As determined by immunofluorescence for synaptophysin-9 (SYP-9; green stain; A) or α-smooth muscle actin (α-SMA) costained with cytokeratin-19 (CK-19; red stain; B) to image bile ducts, HSC activation is increased in WT HFD mice compared with WT control diet (CD) mice; however, HSC activation is decreased in Hdc−/− HFD mice compared with WT HFD mice (A). Insets in A: Magnified images showing activated HSCs surrounding bile ducts. Insets in B: Magnified images showing alpha-SMA staining near bile ducts. Original magnification: ×40 (A and B, main images); ×80 (A and B, insets).
Figure 8
Figure 8
Evaluation of liver inflammation. In liver sections from WT high-fat diet (HFD) mice, there is increased expression of IL-6 and F4/80 compared with WT control diet (CD) mice. IL-6 and F4/80 expression decreases in Hdc−/− HFD mice compared with WT HFD mice. F4/80-positive cells are indicated by arrows. Insets: Magnified images showing biliary inflammation and Kupffer cell activation. Original magnification: ×20 (main images); ×40 (insets).
Figure 9
Figure 9
Histamine levels in serum and cholangiocyte supernatants. A: As measured by enzyme immunoassay (EIA), histamine levels in serum are almost absent in Hdc−/− control diet (CD) and Hdc−/− high-fat diet (HFD) mice compared with controls. B: As measured by EIA, histamine levels in cholangiocyte supernatants from HDC−/ HFD mice are decreased compared with WT HFD mice. Evaluation of leptin/leptin receptor (Ob-R) levels after HFD feeding and human histamine levels. As determined by EIA, serum leptin levels are increased in WT HFD mice compared with WT CD mice. C: Serum leptin levels are further increased in Hdc−/− CD mice compared with WT HFD mice, and even further increased in Hdc−/− HFD mice compared with Hdc−/− CD mice. D: As measured by real-time quantitative PCR (qPCR), cholangiocyte Ob-R expression is increased in WT HFD mice compared with WT CD mice; however, cholangiocyte Ob-R expression is decreased in Hdc−/−HFD mice compared with WT HFD mice. E: As determined by qPCR, Ob-R expression is decreased in large cholangiocytes treated with HDC-shRNA when compared with those treated with negative control shRNA (NEG-shRNA). Data are expressed as means ± SEM (AE). n ≥ 6 reactions for EIA (AC); n ≥ 3 reactions in triplicate for qPCR (DE). P < 0.05 versus WT CD and NEG-shRNA; P < 0.05 versus WT HFD; P < 0.05 versus Hdc−/− CD.
Figure 10
Figure 10
Evaluation of ductular reaction, senescence, and the HDC/histamine/histamine receptor (HR) axis in patients with nonalcoholic fatty liver disease (NAFLD), nonalcoholic steatohepatitis (NASH), or end-stage liver disease. A: Ductular reaction was evaluated by cytokeratin-19 (CK-19) immunohistochemistry and demonstrates that NASH and end-stage liver disease patients display increased ductular reaction compared with control samples. Cyclin-dependent kinase 4 inhibitor (p18) expression was measured by immunohistochemistry in normal livers and NASH patients. B: There is an increase in p18-positive cholangiocytes in NASH patients compared with normal livers. C: Histamine levels increase in patients with NAFLD, NASH, and end-stage liver disease compared with controls. D: HDC and H1 through H4 HR gene expression is significantly up-regulated in NASH patients compared with controls. Data are expressed as means ± SEM (AD). n ≥ 6 reactions for enzyme immunoassay (C); n ≥ 9 reactions for real-time quantitative PCR. P < 0.05 versus control. Original magnification, ×40 (A and B).
Figure 11
Figure 11
Working model. In WT mice fed high-fat diet (HFD), hepatocyte ballooning steatosis, biliary damage/senescence, fibrosis, and hepatic stellate cell (HSC) activation are increased. Furthermore, there is increased leptin and histamine signaling, causing dysregulation of these peptides. In the Hdc−/− mice fed HFD, there are greater increases in hepatocyte damage, ballooning, and steatosis compared with WT HFD mice, primarily because of the loss of histamine-regulated leptin signaling. However, in Hdc−/−mice fed HFD, there is decreased biliary damage, cholangiocyte senescence, fibrotic reaction, and HSC activation. The dysregulation of leptin signaling [demonstrated by increased leptin/decreased leptin receptor (Ob-R)] may be regulated by both autocrine (cholangiocytes) and paracrine (hypothalamus or mast cells) pathways. IBDM, intrahepatic biliary mass.
Supplemental Figure S1
Fibrosis evaluation in isolated cholangiocytes. As shown by real-time quantitative PCR, cholangiocytes isolated from WT high-fat diet (HFD) mice have increased expression of the fibrotic markers fibronectin-1 (FN-1; A) and α-smooth muscle actin (α-SMA; B) when compared with WT control diet (CD) mice; however, these parameters are decreased in cholangiocytes isolated from Hdc−/− HFD mice when compared with WT HFD mice. Data are expressed as means ± SEM. n ≥ 6 reactions in triplicate (A and B). P < 0.05 versus WT CD; P < 0.05 versus WT HFD.
Supplemental Figure S2
Evaluation of collagen type 1a protein expression. By immunofluorescence and semiquantitative analysis, collagen type 1a expression is significantly increased in WT high-fat diet (HFD) mice compared with WT control diet (CD) mice and found primarily around the portal area. The protein expression of collagen type 1a is significantly down-regulated in HDC HFD mice compared with WT HFD mice. Data are expressed as means ± SEM. n ≥ 6 reactions in triplicate. P < 0.05 versus WT CD; P < 0.05 versus WT HFD. Original magnification, ×40. CK-19, cytokeratin-19.
Supplemental Figure S3
Determination of human hepatic stellate cell (hHSC) activation, in vitro. hHSCs treated with supernatants extracted from cholangiocytes isolated from WT high-fat diet (HFD) mice show increased synaptophysin-9 (SYP-9; A) and α-smooth muscle actin (α-SMA; B) expression when compared with hHSCs treated with supernatants from WT control diet (CD) mice. However, these parameters were decreased in hHSCs treated with cholangiocyte supernatants from Hdc−/− HFD mice when compared with WT HFD mice. Data are expressed as means ± SEM. n ≥ 6 reactions in triplicate (A and B). P < 0.05 versus hHSCs + WT CD cholangiocyte supernatants; P < 0.05 versus hHSCs + WT HFD cholangiocyte supernatants. BS, basal.

References

    1. Fitzgerald K.R. Review of article: prevalence of obesity and trends in the distribution of body mass index among US adults, 1999-2010 by Katherine M. Flegal, PhD; Margaret D. Carroll, MSPH; Brian K. Kit, MD; Cynthia L. Ogden, PhD (JAMA 2012;307:491-7) J Vasc Nurs. 2013;31:131–132. - PubMed
    1. Brunt E.M. Pathology of nonalcoholic steatohepatitis. Hepatol Res. 2005;33:68–71. - PubMed
    1. Bugianesi E., Marietti M. Non-alcoholic fatty liver disease (NAFLD)Recenti Prog Med. 2016;107:360–368. Italian. - PubMed
    1. Takahashi Y., Soejima Y., Fukusato T. Animal models of nonalcoholic fatty liver disease/nonalcoholic steatohepatitis. World J Gastroenterol. 2012;18:2300–2308. - PMC - PubMed
    1. Mells J.E., Fu P.P., Kumar P., Smith T., Karpen S.J., Anania F.A. Saturated fat and cholesterol are critical to inducing murine metabolic syndrome with robust nonalcoholic steatohepatitis. J Nutr Biochem. 2015;26:285–292. - PMC - PubMed

Publication types

MeSH terms