Review
. 2018 Mar;24(1):1-9.
doi: 10.3350/cmh.2017.0112. Epub 2017 Dec 18.

Epidemiology of liver cancer in South Korea

Affiliations
Review

Epidemiology of liver cancer in South Korea

Bo Hyun Kim et al. Clin Mol Hepatol. 2018 Mar.

Abstract

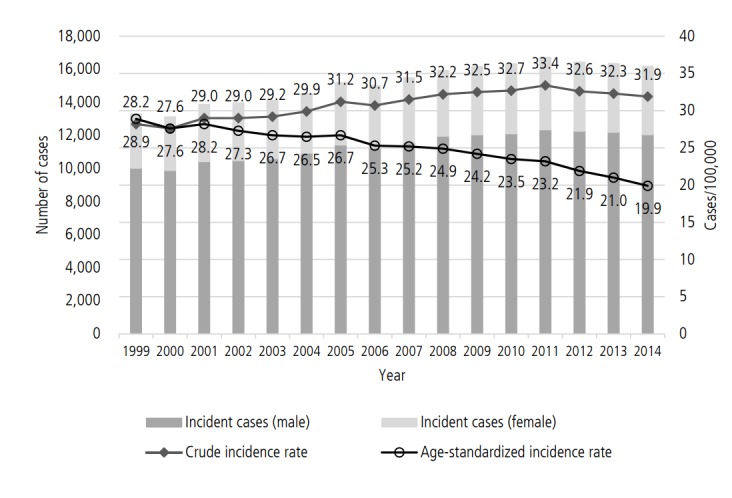
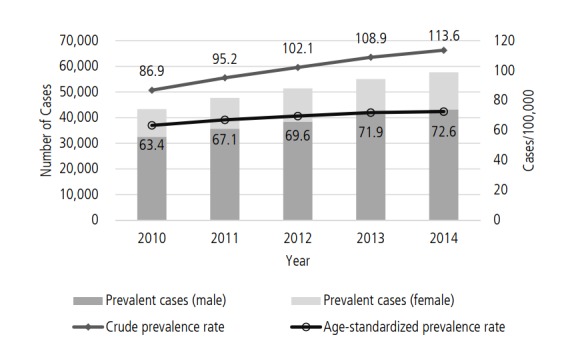
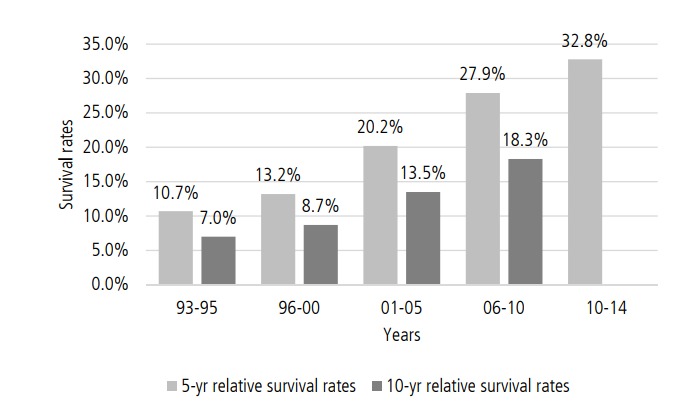
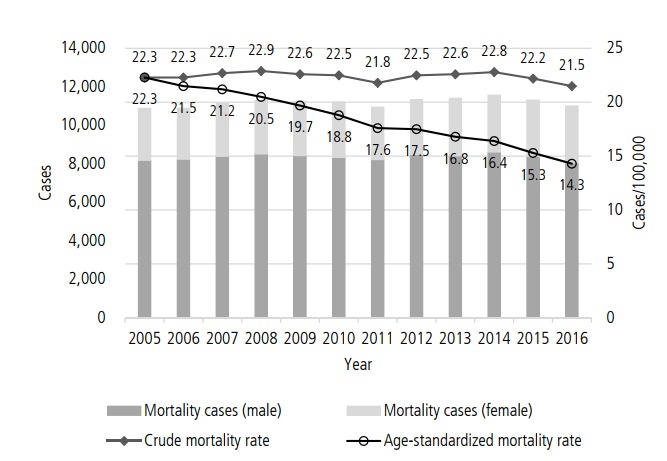
Liver cancer is the sixth most common cancer (fourth in men and sixth in women) and the second largest cause of cancer mortality in South Korea. The crude incidence rate of liver cancer was 31.9/100,000 (47.5/100,000 in men and 16.2/100,000 in women) and the age-standardized incidence rate was 19.9/100,000 (32.4/100,000 in men and 8.8/100,000 in women) in 2014. The crude incidence rate increased from 1999 to 2011 and thereafter showed a subtle decreasing tendency. The crude prevalence rate was 113.6/100,000 (170.2/100,000 in men and 57.1/100,000 in women) and the age-standardized prevalence rate was 72.6/100,000 (115.7/100,000 in men and 33.7/100,000 in women) in 2014, which increased from 2010 to 2014. Survival from liver cancer has improved over the last two decades. The 5-year relative survival rate was markedly increased from 10.7% in those diagnosed with liver cancer between 1993 and 1995 to 32.8% in those diagnosed between 2010 and 2014. The epidemiology of liver cancer is influenced by that of underlying liver diseases such as viral hepatitis. Substantial progress has been made in the prevention and treatment of viral hepatitis; however, uncontrolled alcoholic liver disease, obesity and diabetes appears to have the potential to emerge as major causes for liver cancer. Depending on the success of the control of risk factors, the epidemiology of liver cancer in Korea may change.

Keywords: Epidemiology; Hepatocellular carcinoma; Incidence; Liver cancer; Prevalence.


Conflict of interest statement

Conflict of Interest

The authors have no conflicts to disclose.

Figures

Figure 1.
Figure 1.
Trends in primary liver cancer incidence. Dark grey columns and light grey columns represent the number of male and female incident cases, respectively (left axis). Solid symbols indicate crude incidence rates and hollow symbols indicate age-standardized incidence rates (right axis).
Figure 2.
Figure 2.
Age-specific incidence of liver cancer. (A) Dark grey columns and light grey columns represent the number of male and female incident cases in 2014, respectively (left axis). The black solid line indicates the age-specific incidence rates while the dark grey dashed line and light grey dotted line indicate age-specific incidence rates in males and females, respectively (right axis). (B) Light grey columns and dark grey columns represent the number of cases diagnosed in 2005 and 2014, respectively (left axis). Solid symbols and hollow symbols indicate age-specific incidence rates in 2005 and 2014, respectively (right axis).
Figure 3.
Figure 3.
Crude and age-standardized incidence of liver cancer by region. Light grey columns and dark grey columns represent crude incidence rates in 2005 and 2014, respectively. Solid symbols and hollow symbols indicate age-standardized incidence rates in 2005 and 2014, respectively. SU, Seoul; BS, Busan; DG, Daegu; IC, Incheon; GJ, Gwangju; DJ, Daejeon; US, Ulsan; SJ, Sejong; GG, Gyeonggi-do; GW, Gangwon-do; CB, Chungcheongbuk-do; CN, Chungcheongnam-do; JB, Jeollabuk-do; JN, Jeollanam-do; GB, Gyeongsangbuk-do; GN, Gyeongsangnam-do; JJ, Jeju-do.
Figure 4.
Figure 4.
Trends in prevalence of primary liver cancer. Dark grey columns and light grey columns represent the number of male and female prevalent cases, respectively (left axis). Solid symbols indicate crude prevalence rates and hollow symbols indicate age-standardized prevalence rates (right axis).
Figure 5.
Figure 5.
Age-specific prevalence of liver cancer. (A) Dark grey columns and light grey columns represent the number of male and female prevalent cases in 2014, respectively (left axis). The black solid line indicates the age-specific prevalence while the dark grey dashed line and light grey dotted line indicate age-specific prevalence rates of males and females, respectively (right axis). (B) Light grey columns and dark grey columns represent the number of prevalent cases in 2010 and 2014, respectively (left axis). Solid symbols and hollow symbols indicate age-specific prevalence rates in 2010 and 2014, respectively (right axis).
Figure 6.
Figure 6.
Trends in primary liver cancer survival. Light grey columns and dark grey columns denote 5-year relative survival rates (the ratio of survival rates of individuals who were diagnosed with liver cancer to those who were not) and 10-year relative survival rates, respectively.
Figure 7.
Figure 7.
Trends in liver cancer mortality rates. Dark grey columns and light grey columns represent the number of male and female mortality cases from liver cancer, respectively (left axis). Solid symbols indicate crude mortality rates and hollow symbols indicate age-standardized mortality rates (right axis).
Figure 8.
Figure 8.
Age distribution of cancer mortality. The upper bar represents percentages of mortality cases from all-sites cancers and the lower bar represents those of mortality cases from liver cancer according to the ages.

References

    1. Ferlay J, Soerjomataram I, Dikshit R, Eser S, Mathers C, Rebelo M, et al. Cancer incidence and mortality worldwide: sources, methods and major patterns in GLOBOCAN 2012. Int J Cancer. 2015;136:E359–E386. - PubMed
    1. McGlynn KA, Petrick JL, London WT. Global epidemiology of hepatocellular carcinoma: an emphasis on demographic and regional variability. Clin Liver Dis. 2015;19:223–238. - PMC - PubMed
    1. Korea Central Cancer Registry. National Cancer Center . Annual report of cancer statistics in Korea in 2014. Ministry of Health and Welfare 2016.
    1. Lee BS, Cho YK, Jeong SH, Lee JH, Lee D, Park NH, et al. Nationwide seroepidemiology of hepatitis B virus infection in South Korea in 2009 emphasizes the coexistence of HBsAg and anti-HBs. J Med Virol. 2013;85:1327–1333. - PubMed
    1. Kim DY, Kim IH, Jeong SH, Cho YK, Lee JH, Jin YJ, et al. A nationwide seroepidemiology of hepatitis C virus infection in South Korea. Liver Int. 2013;33:586–594. - PubMed

LinkOut - more resources