. 2018 Sep;59(9):2188-2200.
doi: 10.1080/10428194.2017.1410882. Epub 2017 Dec 18.

A tool compound targeting the core binding factor Runt domain to disrupt binding to CBFβ in leukemic cells

Affiliations

A tool compound targeting the core binding factor Runt domain to disrupt binding to CBFβ in leukemic cells

Zaw Min Oo et al. Leuk Lymphoma. 2018 Sep.

Abstract

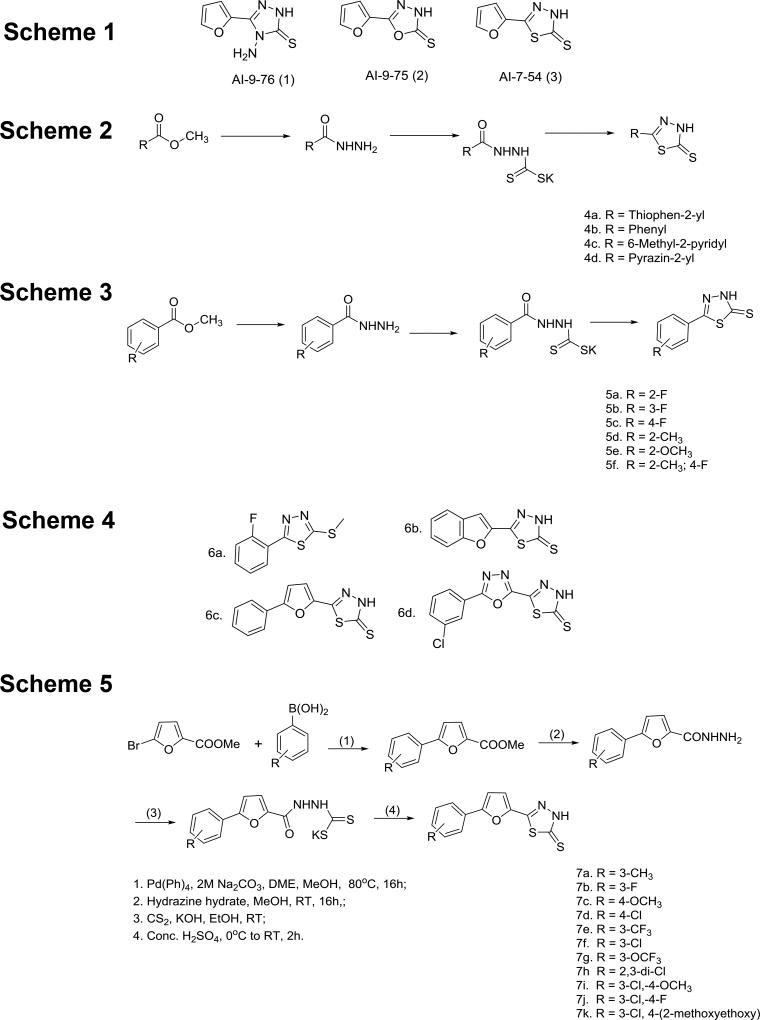
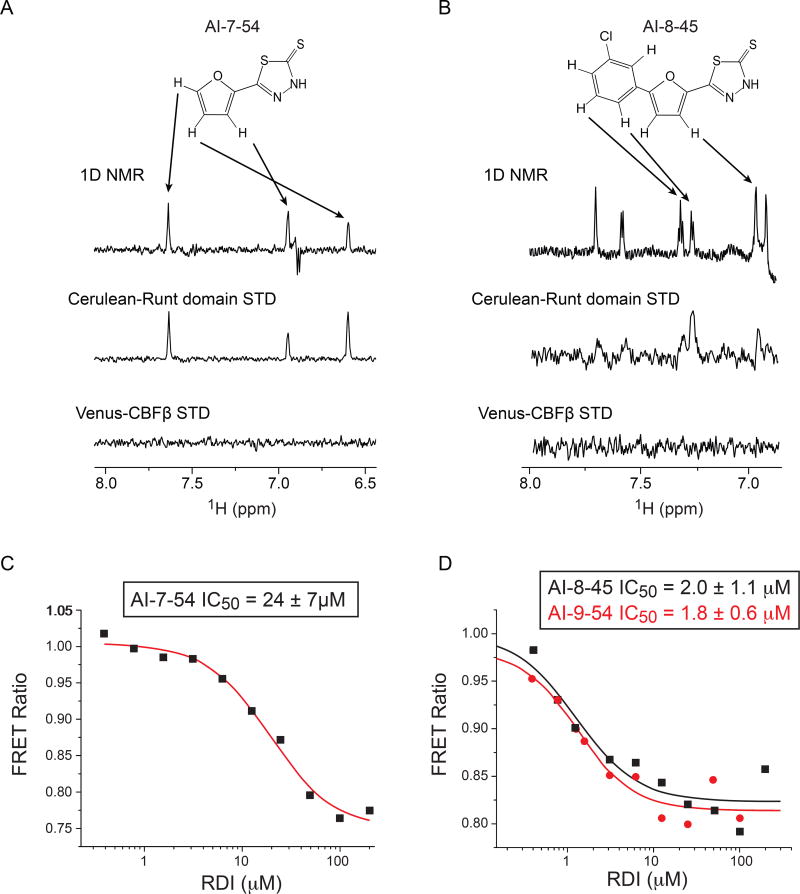
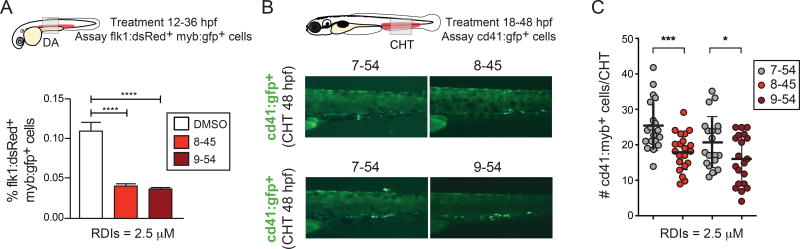
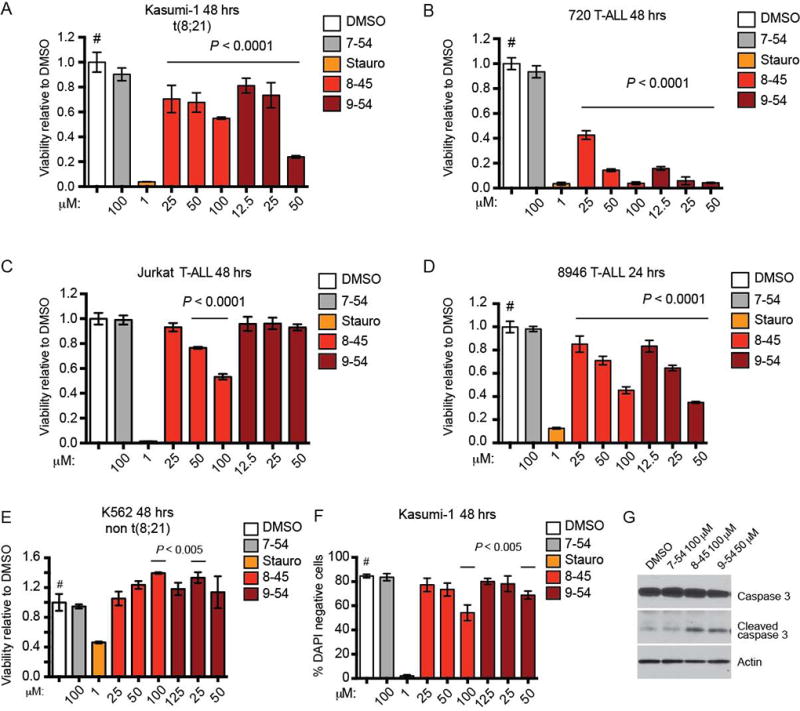
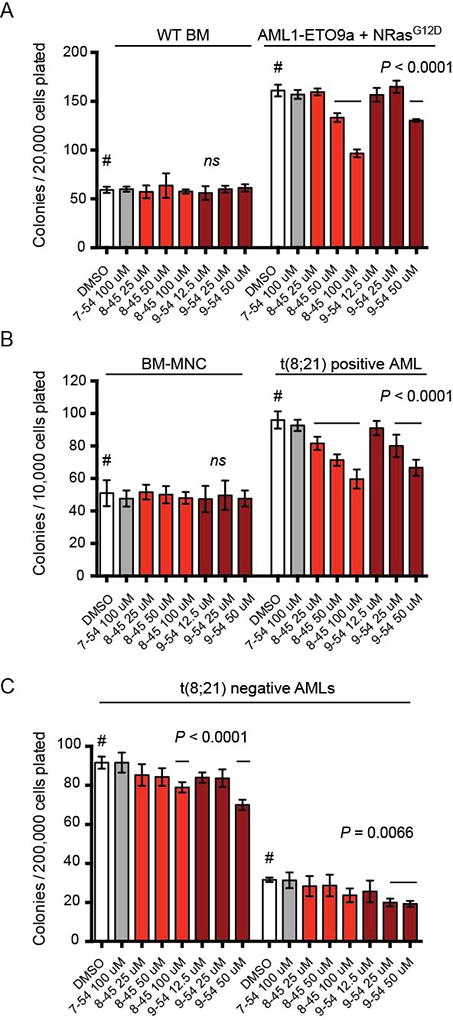
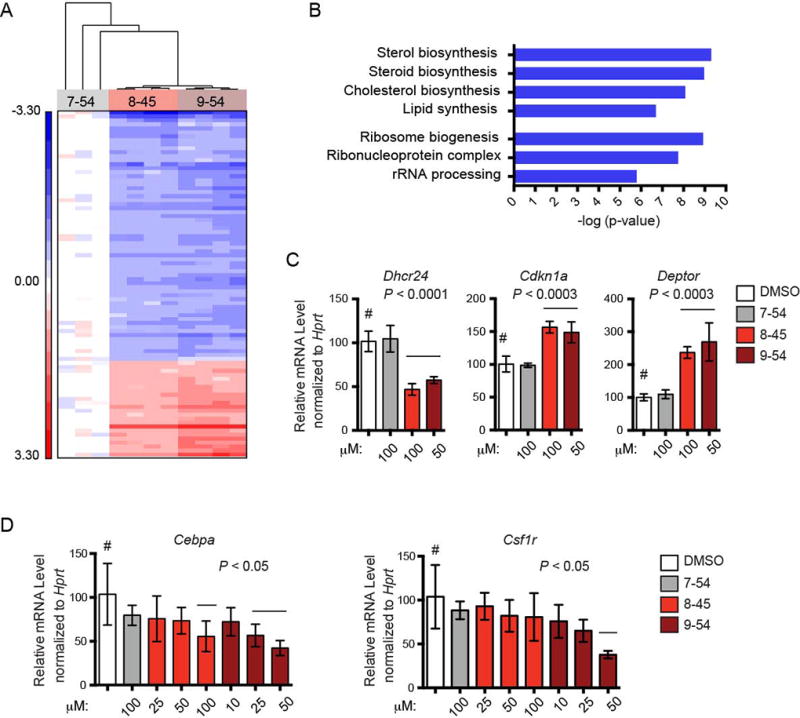
The core binding factor (CBF) gene RUNX1 is a target of chromosomal translocations in leukemia, including t(8;21) in acute myeloid leukemia (AML). Normal CBF function is essential for activity of AML1-ETO, product of the t(8;21), and for survival of several leukemias lacking RUNX1 mutations. Using virtual screening and optimization, we developed Runt domain inhibitors which bind to the Runt domain and disrupt its interaction with CBFβ. On-target activity was demonstrated by the Runt domain inhibitors' ability to depress hematopoietic cell formation in zebrafish embryos, reduce growth and induce apoptosis of t(8;21) AML cell lines, and reduce progenitor activity of mouse and human leukemia cells harboring the t(8;21), but not normal bone marrow cells. Runt domain inhibitors had similar effects on murine and human T cell acute lymphocytic leukemia (T-ALL) cell lines. Our results confirmed that Runt domain inhibitors might prove efficacious in various AMLs and in T-ALL.

Keywords: AML1-ETO; CBFB; Leukemia; PPI; RUNX; TEL-AML1; protein–protein interaction inhibitor.


Conflict of interest statement

Conflict of Interest

The authors declare they have no competing financial interests.

Figures

Figure 1
Figure 1. Library of analogs synthesized
Schemes 1–5 illustrate the synthetic routes used for library generation and refer to sets of compounds described in the main text.
Figure 2
Figure 2. NMR STD and FRET data for Runt domain inhibitors
A. Results of NMR saturation transfer (STD) analysis for AI-7–54. The structure of AI-7–54 is shown with a 1D 1H NMR spectrum of the compound below. Arrows indicate resonance assignments. The middle spectrum shows 1D difference spectrum for Cerulean-Runt domain + AI-7–54. Bottom spectrum shows 1D difference spectrum for Venus-CBFβ, demonstrating a lack of binding. B. Results of STD analysis for AI-8–45, as in panel A. C,D. Results of FRET analysis for the initial lead AI-7–54 (C) and optimized compounds AI-8–45 and AI-9–54 (D). Calculated IC50 values (average of two measurements ± standard deviation) are shown.
Figure 3
Figure 3. The RDIs inhibit hematopoietic stem and progenitor cell (HSPC) formation in zebrafish embryos
A. Transgenic Tg(kdrl:dsred;cmyb:egfp) zebrafish HSPC-reporter embryos were incubated with the RDIs (2.5 µM) from 12–36 hpf, and analyzed at 36 hpf by flow cytometry. Shown is the percentage of Flk1:dsRed+Myb:Gfp+ HSPCs per whole embryo. Data are compiled from 3 clutches (n = 20 embryos/condition embryos). Significance determined by Student’s t-test. B. Cd41:Gfp+ HSPCs in the caudal hematopoietic tissue (CHT) of representative 48 hpf Tg(−6.0itga2b:egfp) zebrafish embryos following incubation with RDIs from 18–48 hpf. Comparisons of AI-8–45 to AI-7–54, and AI-9–54 to A7–54 were performed in separate experiments. C. Number of Cd41:Gfp+cells in the CHT as determined from fluorescence microscopy analysis, averaged from 20 embryos/condition in replicate experiments. Shown are pair-wise comparative data from two representative clutches.
Figure 4
Figure 4. RDIs reduce cell growth and induce apoptosis in leukemia cells
A–E. RDIs AI-8–45 (8–45) and AI-9–54 (9–54) inhibit proliferation of the AML cell line Kasumi-1 and the T-ALL lines 720, Jurkat (8–45 only), and 8946, but not K562 as detected by MTT cell viability assay. AI-7–54 (7–54) is the negative control, and staurosporine (Stauro) is a positive control. Data represent mean values for triplicates ± standard deviation (SD) (two independent experiments). P values were calculated by one-way ANOVA (staurosporine-treated cells were not included in the ANOVA analysis). Dunnett’s Multiple Comparison test was performed using DMSO treated cells as the comparator (#); horizontal lines above columns indicate significant differences from DMSO treated cells (P ≤ 0.05). F. RDIs reduce the percentage of live (DAPI negative) Kasumi-1 cells as measured by flow cytometry. Data represents mean values of two independent experiments; statistical analysis as in A–E. G. RDI treatment results in increased caspase-3 cleavage in 720 T-ALL cells (48 hrs).
Figure 5
Figure 5. Effect of RDIs on colony formation by normal and leukemic mouse bone marrow cells, and in human AML samples
A. Various concentrations of compound were added to methylcellulose cultures containing 20,000 wild type bone marrow cells or 20,000 leukemic mouse cells transformed with AE9a and NRasG12D. All compounds were dissolved in DMSO (final concentration 0.2%). Colonies were counted 7 days after plating. Shown is a representative experiment (n=3 per compound concentration, two experiments). Error bars represent SD. Significance relative to DMSO was determined by one-way ANOVA and Dunnett’s multiple-comparison test as in Figure 4. B–C. Various concentrations of compound were added to methylcellulose cultures containing bone marrow mononuclear cells (MNC) or primary AML samples. Colonies were counted 14 days after plating. Shown is a representative experiment (n=3 per compound concentration, two experiments). Significance relative to DMSO treatment was determined by one-way ANOVA and Dunnett’s multiple-comparison test as in Figure 4.
Figure 6
Figure 6. Microarray analysis of gene expression changes induced by RDIs
A. Hierarchical clustering of 87 transcript IDs (78 genes) differentially expressed (False Discovery Rate 5%) among 720 T-ALL cells treated for 8 hrs with AI-7–54 (100 µM), AI-8–45 (100 µM), or AI-9–54 (50 µM). Red represents genes up-regulated relative to mean expression level in AI-7–54 treated cells; blue represents genes down-regulated relative to mean expression level in AI-7–54 treated cells. B. KEGG pathways downregulated following RDI treatment from functional annotation clustering. C. Relative expression of genes in 720 T-ALL cells treated with RDIs for 16 hours, measured by qPCR. Data represents mean values for triplicates ± SD, n= two experiments. Significance relative to DMSO treatment was determined by one-way ANOVA. Dunnett’s Multiple Comparison test was performed using DMSO treated cells as the comparator (#); horizontal lines above columns indicate significant differences from DMSO treated cells (P ≤ 0.05). D. Relative expression of Runx1-regulated differentiation genes, as in panel C.

References

    1. Mangan JK, Speck NA. RUNX1 mutations in clonal myeloid disorders: from conventional cytogenetics to next generation sequencing, a story 40 years in the making. Critical reviews in oncogenesis. 2011;16(1–2):77–91. - PMC - PubMed
    1. Lam K, Zhang DE. RUNX1 and RUNX1-ETO: roles in hematopoiesis and leukemogenesis. Frontiers in bioscience. 2012;17:1120–39. - PMC - PubMed
    1. Cai Z, de Bruijn MFTR, Ma X, Dortland B, Luteijn T, Downing JR, et al. Haploinsufficiency of AML1/CBFA2 affects the embryonic generation of mouse hematopoietic stem cells. Immunity. 2000;13:423–31. - PubMed
    1. Cai X, Gaudet JJ, Mangan JK, Chen MJ, De Obaldia ME, Oo Z, et al. Runx1 loss minimally impacts long-term hematopoietic stem cells. PloS one. 2011;6(12):e28430. - PMC - PubMed
    1. Motoda L, Osato M, Yamashita N, Jacob B, Chen LQ, Yanagida M, et al. Runx1 protects hematopoietic stem/progenitor cells from oncogenic insult. Stem cells. 2007 Dec;25(12):2976–86. - PubMed

Publication types

MeSH terms

Substances