. 2018 Jan 11;172(1-2):106-120.e21.
doi: 10.1016/j.cell.2017.11.023. Epub 2017 Dec 14.

Nudt21 Controls Cell Fate by Connecting Alternative Polyadenylation to Chromatin Signaling

Affiliations

Nudt21 Controls Cell Fate by Connecting Alternative Polyadenylation to Chromatin Signaling

Justin Brumbaugh et al. Cell. .

Erratum in

Abstract

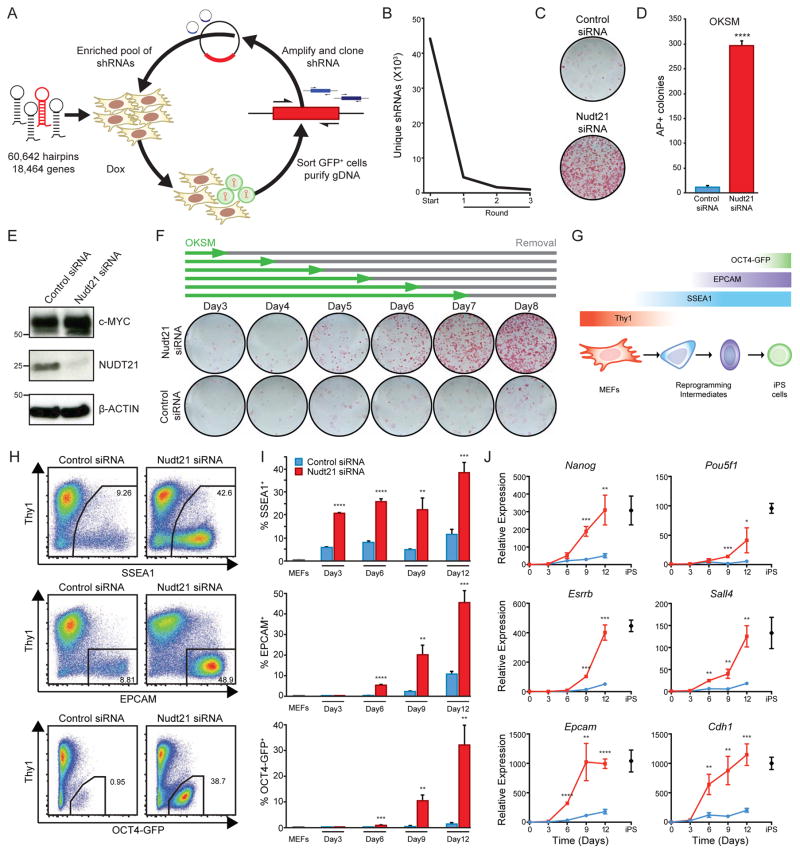
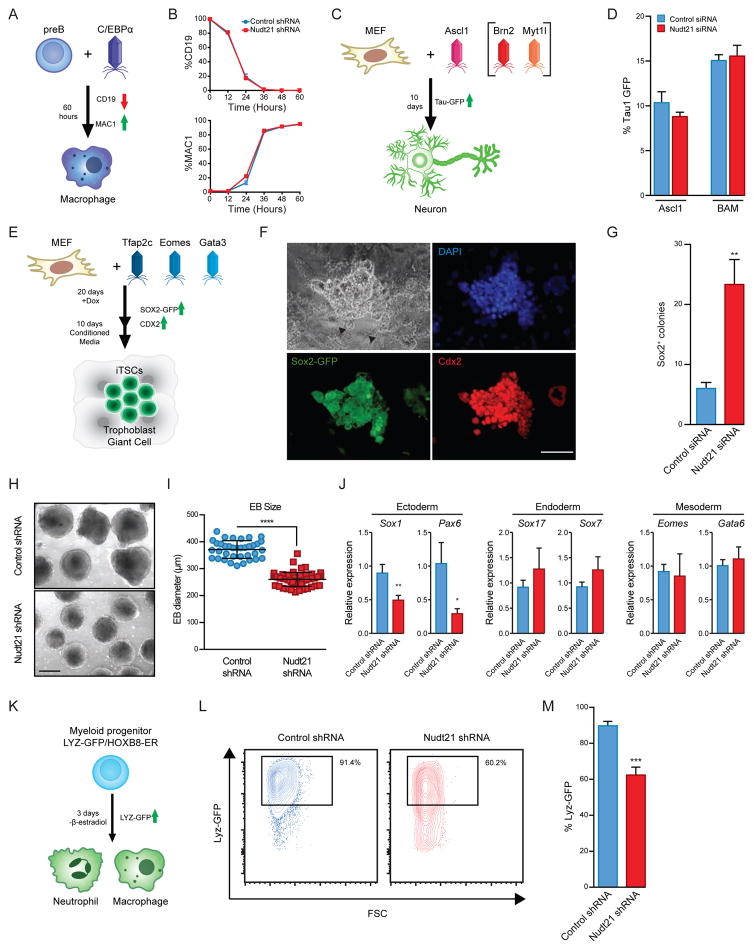
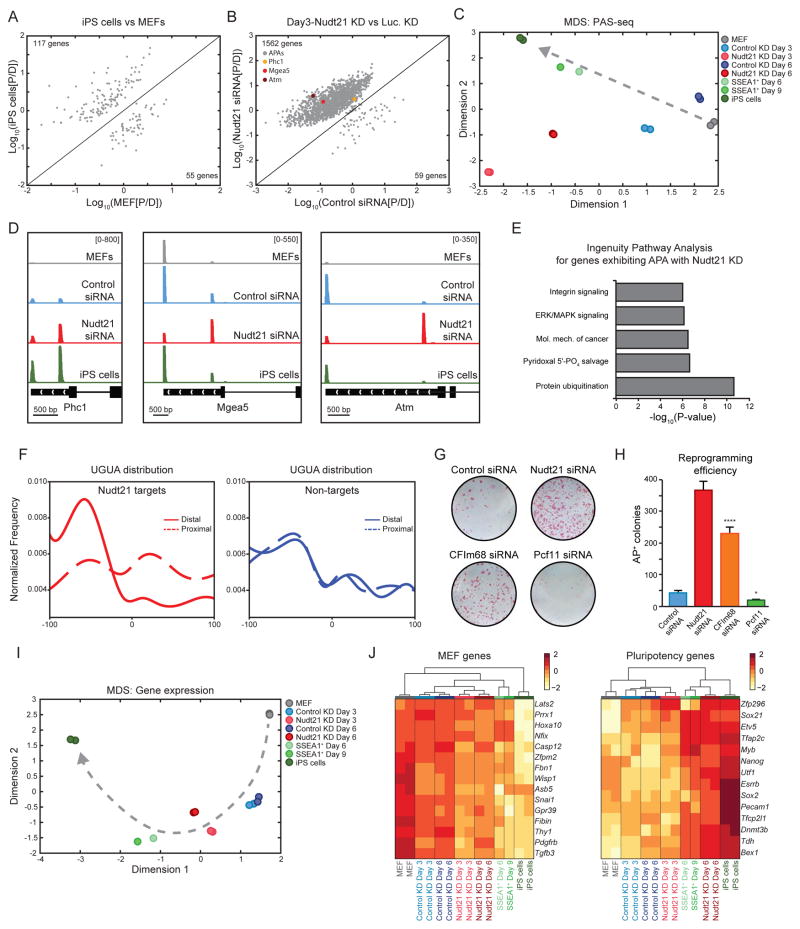
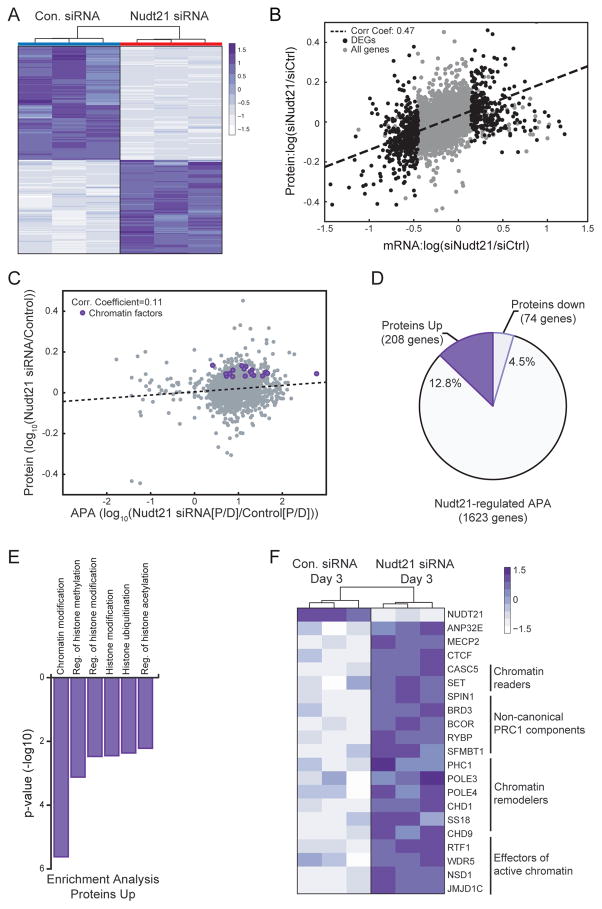
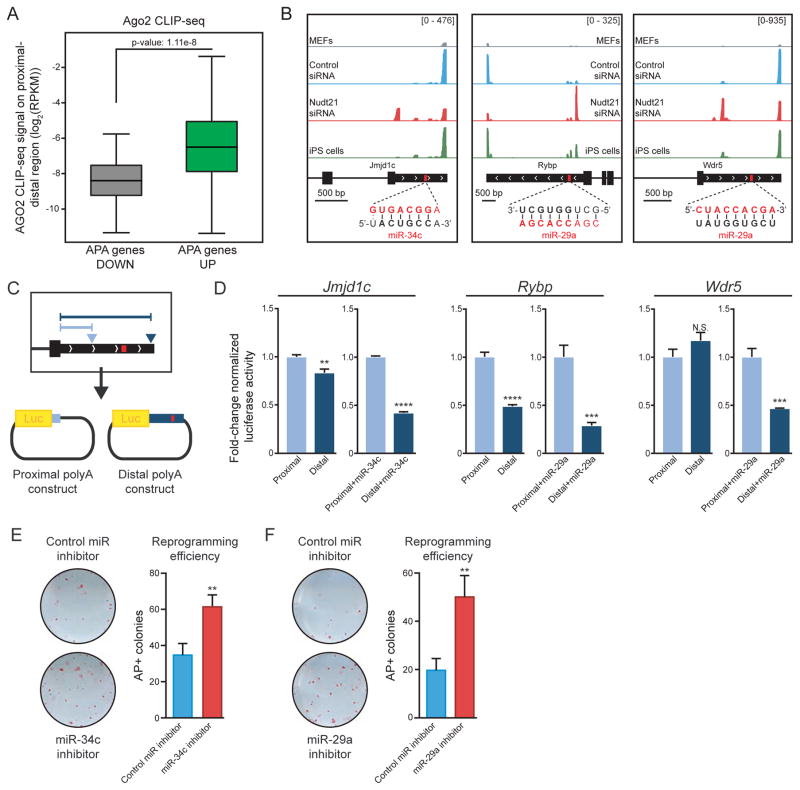
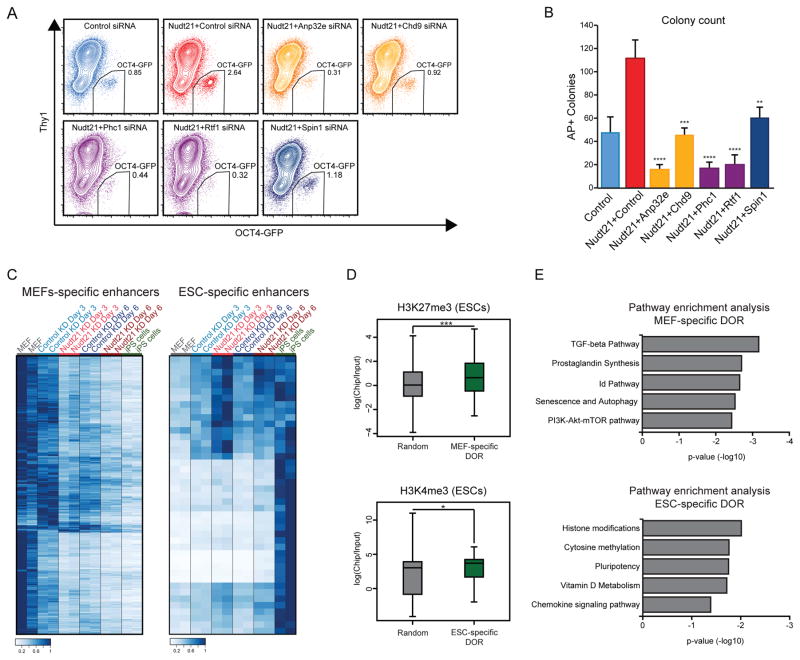
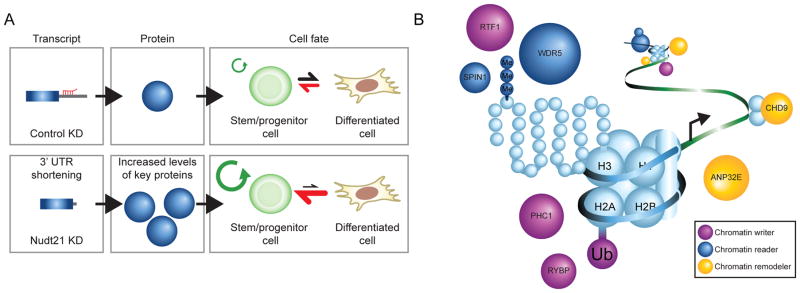
Cell fate transitions involve rapid gene expression changes and global chromatin remodeling, yet the underlying regulatory pathways remain incompletely understood. Here, we identified the RNA-processing factor Nudt21 as a novel regulator of cell fate change using transcription-factor-induced reprogramming as a screening assay. Suppression of Nudt21 enhanced the generation of induced pluripotent stem cells, facilitated transdifferentiation into trophoblast stem cells, and impaired differentiation of myeloid precursors and embryonic stem cells, suggesting a broader role for Nudt21 in cell fate change. We show that Nudt21 directs differential polyadenylation of over 1,500 transcripts in cells acquiring pluripotency, although only a fraction changed protein levels. Remarkably, these proteins were strongly enriched for chromatin regulators, and their suppression neutralized the effect of Nudt21 during reprogramming. Collectively, our data uncover Nudt21 as a novel post-transcriptional regulator of cell fate and establish a direct, previously unappreciated link between alternative polyadenylation and chromatin signaling.

Keywords: Alternative polyadenylation; chromatin; embryonic stem cells; epigenetic regulation; induced pluripotent stem cells; induced trophoblast stem cells; microRNA; pluripotency; reprogramming; transdifferentiation.


Figures

Figure 1
Figure 1. A serial siRNA screen identifies Nudt21 as a potent barrier to reprogramming
A) A schematic of the serial enrichment shRNA screen. B) shRNA library complexity during hairpin enrichment. C) AP staining of transgene-independent iPS colonies. Cells were induced with dox for 12 days, followed by 4 days of dox withdrawal. D) Quantification of AP staining. E) Western blot analysis showing Nudt21 knockdown with siRNA at day three of reprogramming. F) Dox withdrawal assay. Cells were induced for the indicated time period after which dox was replaced with ES media until analysis at day 15. G) A schematic of the markers used to determine the progression of reprogramming. H) Flow cytometry analysis of intermediate reprogramming markers, SSEA1, EPCAM, and OCT4-GFP at day 12 of induction. I) Time course quantification of flow cytometry analysis. J) Time course qRT-PCR quantification of gene expression for select pluripotency genes. Statistical significance was determined using multiple t-test with 1% false discovery rate. See also Figure S1. n=3 independent experiments, mean ± SD, * p<0.05; ** p<0.01; *** p<0.001; **** p<0.0001, unpaired Student’s t-test.
Figure 2
Figure 2. Nudt21 suppression enhances the transdifferentiation of MEFs to iTSCs, yet delays ESC and myeloid differentiation
A) A schematic of B cell to macrophage transdifferentiation. B) Time course analysis for lineage markers during B cell to macrophage transdifferentiation. C) A schematic of MEF to neuron transdifferentiation. D) Quantification of neural transdifferentiation. E) A schematic of MEF to trophoblast stem cell transdifferentiation. F) Immunofluorescence images showing staining for SOX2-GFP and CDX2. Scale bar=100 μm. Arrowheads indicate trophoblast giant cells. G) Quantification of iTSC colonies following transdifferentiation. H) Brightfield images of EBs after 6 days of differentiation. Scale bar =200 μm. I) Quantification of EB diameters for each condition in technical replicate from three independent experiments (Control shRNA, n=36; Nudt21 shRNA, n=58). The center bar and whiskers represent the mean and standard deviation of the mean, respectively. (J) qRT-PCR for lineage markers at day 6 of induction. K) A schematic of the Hoxb8 differentiation system. L) Flow cytometry analysis showing lysozyme-GFP levels for cells under differentiation conditions. M) Quantification for differentiation from progenitor cells to myeloid lineages. See also Figure S2. n=3 independent experiments, mean ± SD, * p<0.05; ** p<0.01; *** p<0.001; **** p<0.0001, unpaired Student’s t-test.
Figure 3
Figure 3. Nudt21 suppression facilitates APA and gene expression changes
A) A correlation plot comparing polyA site usage for iPSCs vs MEFs. B) A correlation plot comparing polyA site usage at Day3 of reprogramming for Nudt21 siRNA vs control siRNA. C) Multi-dimensional scaling analysis for APA. D) Gene tracks showing alternative polyadenylation for Nudt21 targets. Control and Nudt21 knockdown samples were analyzed at day 3 of reprogramming. E) Ingenuity pathway analysis of APA at day 3 of reprogramming for Nudt21 siRNA vs control siRNA. F) UGUA distribution around polyA sites. G) AP staining of transgene-independent iPS colonies following reprogramming. Cells were induced with dox for 12 days, followed by 4 days of dox withdrawal. H) Quantification of AP staining of transgene-independent iPS colonies from panel E. I) Multi-dimensional scaling analysis for gene expression. J) Heat maps for select MEF and pluripotency genes. See also Table S1 and Figure S3. n=3 independent experiments, mean ± SD, * p<0.05; **** p<0.0001, unpaired Student’s t-test.
Figure 4
Figure 4. Large-scale quantitative proteomics analysis reveals a subset of upregulated Nudt21 targets that are enriched for chromatin modifiers
A) A heat map for differentially expressed proteins exhibiting a 1.2-fold or greater difference between Nudt21 and control siRNA at day 3 of reprogramming. B) A correlation plot (p-value=0) comparing mRNA to protein expression at day 3 of reprogramming. C) A correlation plot (p-value=8.84×10⁻⁵) comparing APA to protein expression at day 3 of reprogramming. D) A pie chart showing the percent of Nudt21 targets that change protein levels 1.2-fold or greater by day 3 of reprogramming. E) Gene Ontology analysis for Nudt21 target proteins that increase expression 1.2-fold or greater by day 3 of reprogramming. F) A heatmap of chromatin modifiers that change both protein levels and polyadenylation site usage. See also Table S2 and Figure S4.
Figure 5
Figure 5. Nudt21 targets are regulated by miRNAs
A) Ago2 CLIP-seq enrichment on transcripts that change polyadenylation following Nudt21 knockdown. The center bar, boxes, and whiskers represent the median, first to third quartile, and minimum/maximum values, respectively. B) Gene tracks showing APA for Jmjdc1 and Rybp. The inset shows microRNA seed sequences in bold for each transcript. Control and Nudt21 knockdown samples were analyzed at day 3 of reprogramming. C) A schematic of the luciferase assay to assess the effect of 3′ UTR length on protein expression. Arrows represent polyA sites and the red box represents a miRNA binding site. D) Normalized luciferase assay for the indicated genes with or without miRNA mimicks. E) AP staining of transgene-independent iPS colonies generated with miR-34c inhibitor or miR inhibitor control. Cells were induced with dox for 12 days, followed by 4 days of dox withdrawal. F) AP staining of transgene-independent iPS colonies generated with miR-29a inhibitor or miR inhibitor control. Cells were induced with dox for 12 days, followed by 4 days of dox withdrawal. See also Figures S4 and S5. n=3 independent experiments, mean ± SD, N.S., not significant, ** p<0.01; *** p<0.001; **** p<0.0001, unpaired Student’s t-test.
Figure 6
Figure 6. Chromatin modifiers targeted by Nudt21 mediate cell fate change
A) Flow cytometry analysis showing OCT4-GFP levels at day 9 of reprogramming, following double knockdown of Nudt21 and the indicated chromatin factors. B) Quantification of transgene-independent iPS colonies, following double knockdown of Nudt21 and the indicated chromatin factors. C) Heatmaps of ATAC-seq read density for peaks at MEF-specific enhancers (left) and ESC-specific enhancers (right), colored by the ratio to the highest coverage for each enhancer. D) H3K27me3 and H3K4me3 coverage at TSS of genes proximal to the indicated enhancers. The center bar, boxes, and whiskers represent the median, first to third quartile, and minimum/maximum values, respectively. E) Pathway enrichment analysis for genes associated with the MEF- and ESC-specific enhancer. See also Figure S6. n=3 independent experiments, mean ± SD, * p<0.05; ** p<0.01; *** p<0.001; **** p<0.0001, unpaired Student’s t-test.
Figure 7
Figure 7. Nudt21 alters polyadenylation site usage and modulates cell fate transitions
A) A model showing the effect of Nudt21 knockdown. B) A model showing the molecular mechanism of Nudt21 knockdown.

References

    1. Ang YS, Tsai SY, Lee DF, Monk J, Su J, Ratnakumar K, Ding J, Ge Y, Darr H, Chang B, et al. Wdr5 mediates self-renewal and reprogramming via the embryonic stem cell core transcriptional network. Cell. 2011;145:183–197. - PMC - PubMed
    1. Apostolou E, Hochedlinger K. Chromatin dynamics during cellular reprogramming. Nature. 2013;502:462–471. - PMC - PubMed
    1. Arnold K, Sarkar A, Yram MA, Polo JM, Bronson R, Sengupta S, Seandel M, Geijsen N, Hochedlinger K. Sox2(+) adult stem and progenitor cells are important for tissue regeneration and survival of mice. Cell stem cell. 2011;9:317–329. - PMC - PubMed
    1. Bar-Nur O, Brumbaugh J, Verheul C, Apostolou E, Pruteanu-Malinici I, Walsh RM, Ramaswamy S, Hochedlinger K. Small molecules facilitate rapid and synchronous iPSC generation. Nature methods. 2014;11:1170–1176. - PMC - PubMed
    1. Beausoleil SA, Villen J, Gerber SA, Rush J, Gygi SP. A probability-based approach for high-throughput protein phosphorylation analysis and site localization. Nature biotechnology. 2006;24:1285–1292. - PubMed

Publication types

Substances