. 2018 Jan 11;172(1-2):90-105.e23.
doi: 10.1016/j.cell.2017.11.031. Epub 2017 Dec 14.

R-2HG Exhibits Anti-tumor Activity by Targeting FTO/m6A/MYC/CEBPA Signaling

Affiliations

R-2HG Exhibits Anti-tumor Activity by Targeting FTO/m6A/MYC/CEBPA Signaling

Rui Su et al. Cell. .

Abstract

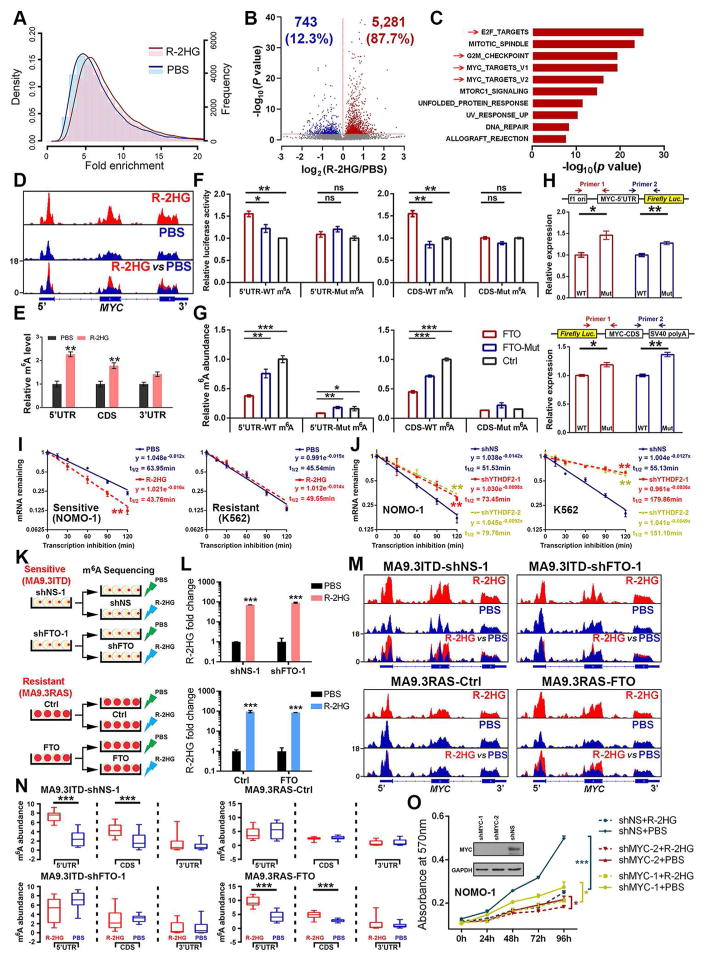
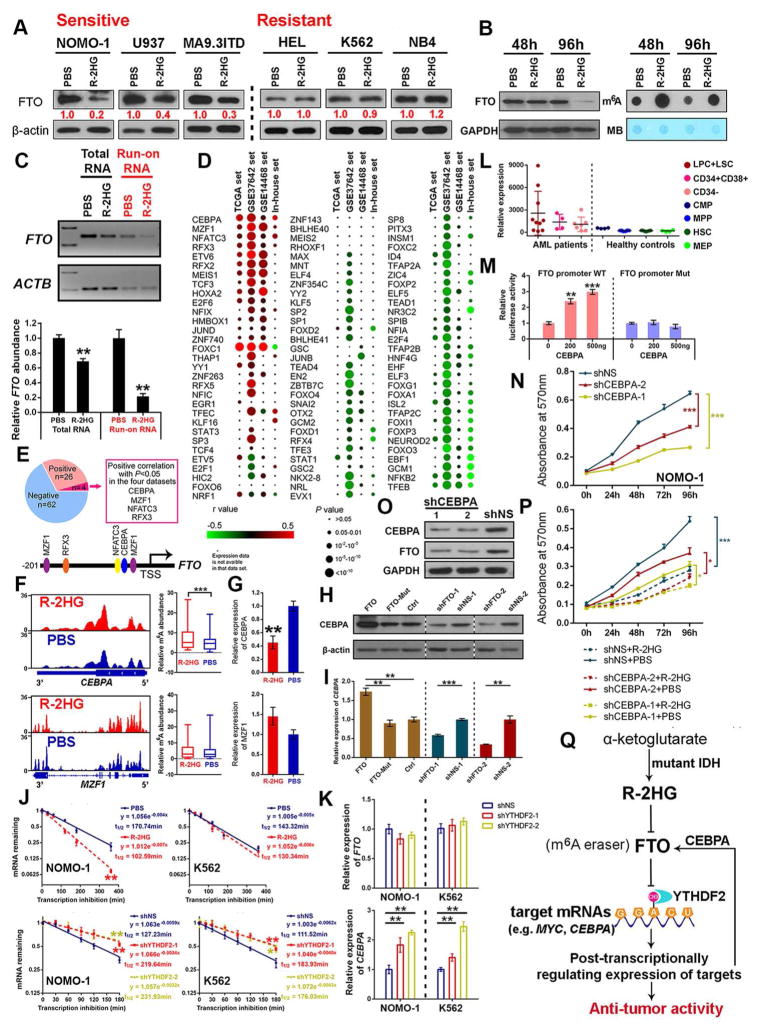
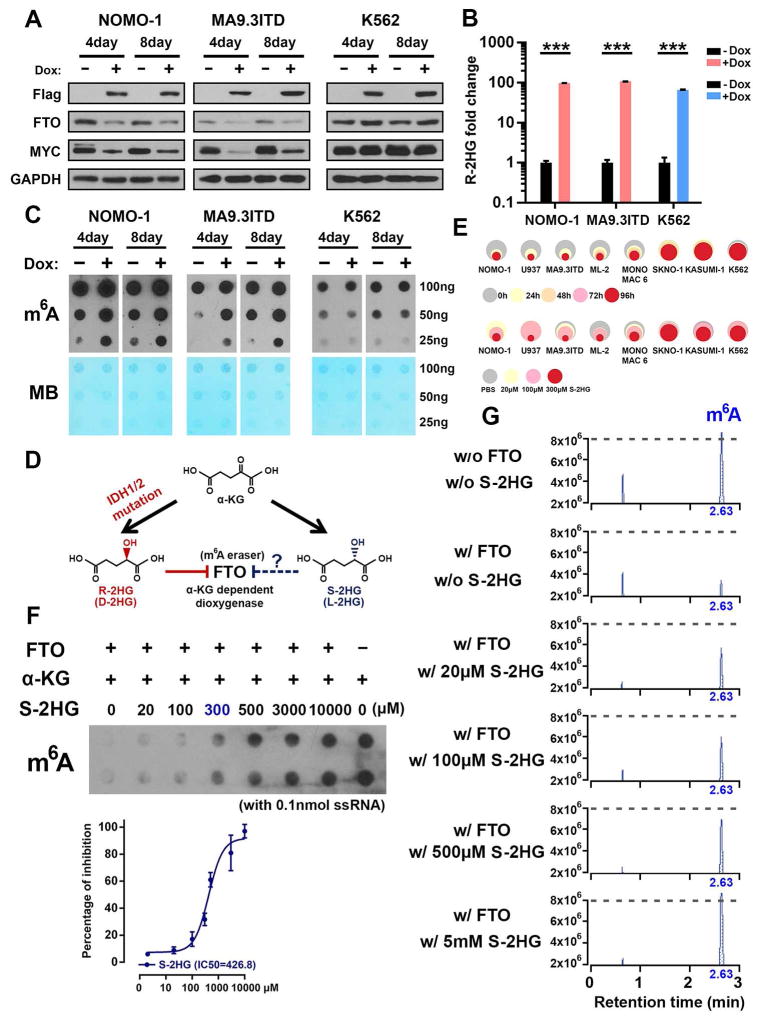
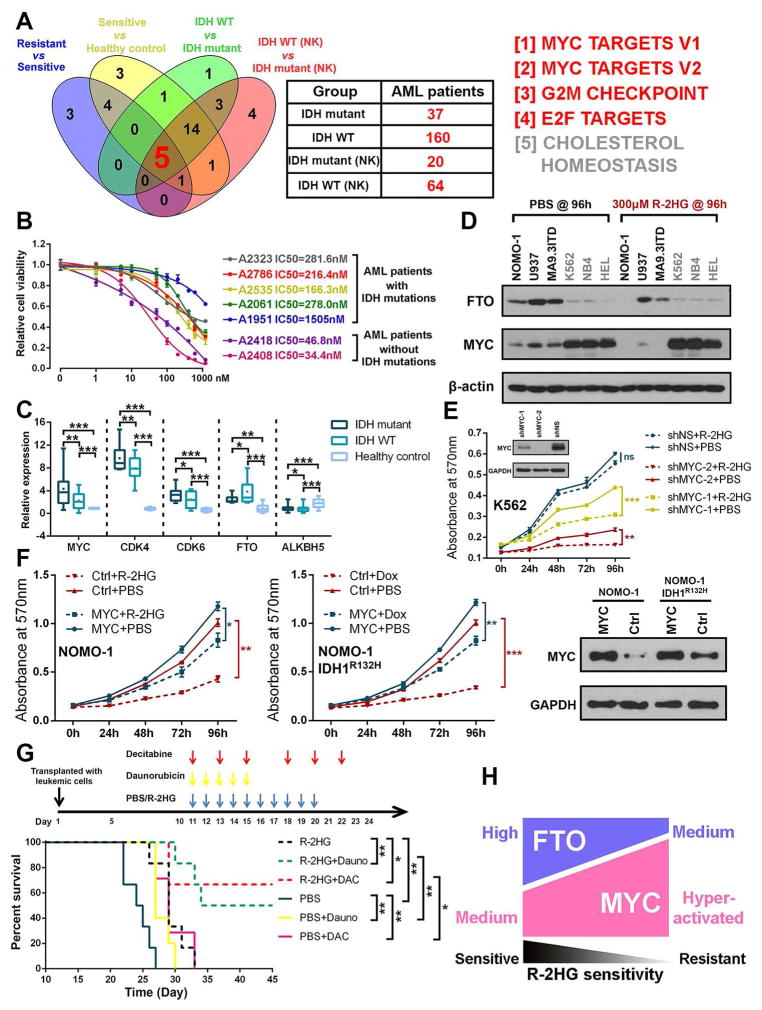
R-2-hydroxyglutarate (R-2HG), produced at high levels by mutant isocitrate dehydrogenase 1/2 (IDH1/2) enzymes, was reported as an oncometabolite. We show here that R-2HG also exerts a broad anti-leukemic activity in vitro and in vivo by inhibiting leukemia cell proliferation/viability and by promoting cell-cycle arrest and apoptosis. Mechanistically, R-2HG inhibits fat mass and obesity-associated protein (FTO) activity, thereby increasing global N6-methyladenosine (m6A) RNA modification in R-2HG-sensitive leukemia cells, which in turn decreases the stability of MYC/CEBPA transcripts, leading to the suppression of relevant pathways. Ectopically expressed mutant IDH1 and S-2HG recapitulate the effects of R-2HG. High levels of FTO sensitize leukemic cells to R-2HG, whereas hyperactivation of MYC signaling confers resistance that can be reversed by the inhibition of MYC signaling. R-2HG also displays anti-tumor activity in glioma. Collectively, while R-2HG accumulated in IDH1/2 mutant cancers contributes to cancer initiation, our work demonstrates anti-tumor effects of 2HG in inhibiting proliferation/survival of FTO-high cancer cells via targeting FTO/m6A/MYC/CEBPA signaling.

Keywords: CEBPA; FTO; IDH mutation; MYC; N(6)-methyladenosine (m(6)A); R-2HG; S-2HG; glioma; leukemia.


Figures

None
Synthesis scheme of m6Am from 2′-OMe-inosine.
Figure 1
Figure 1. R-2HG Displays Anti-leukemic Activity in vitro and in vivo
(A) Relative cell viabilities of leukemia cell lines treated with 300 μM cell-permeable R-2HG for the indicated times. The colors represent different time points; the diameter indicates the relative cell viability. H, hour. (B) Relative cell viabilities of the cell lines at 96 hours post-treatment with different concentrations of R-2HG. The colors represent different R-2HG concentrations; the diameter represents relative cell viability. (C) Schematic illustration of leukemic mouse models with R-2HG (or PBS) in vivo injection. (D) Kaplan-Meier curves of leukemic mouse models xeno-transplanted with sensitive (NOMO-1 and MA9.3ITD) or resistant (MA9.3RAS) cells followed by PBS or R-2HG injection. NRGS mice were used for the NOMO-1 and MA9.3RAS models, while NSGS mice were used for the MA9.3ITD model. (E) Spleen weight of MA9.3ITD- or MA9.3RAS-xenotransplanted mice with PBS or R-2HG injection. (F) Schematic illustration of leukemic mouse models with IDH1R132H-mediated generation of R-2HG. (G) Kaplan-Meier curves of NOMO-1_IDH1R132H, MA9.3ITD_IDH1R132H, and NB4_IDH1R132H mouse models with or without doxycycline (Dox) induction. NRGS mice were used for the NOMO-1_IDH1R132H and MA9.3ITD_IDH1R132H models, while NSGS mice were used for the NB4_IDH1R132H model. (H) Spleen weight of MA9.3ITD_IDH1R132H and NB4_IDH1R132H leukemic mice with or without Dox induction. (I and J) Engraftment of MA9.3ITD (I) and MA9.3RAS (J) AML cells into PB, BM and spleen upon R-2HG or PBS injection. (K) Engraftment of MA9.3ITD_IDH1R132H cells into recipient mice with or without Dox induction. (L) Wright-Giemsa staining of PB from leukemia mouse models. Arrows indicate the immature leukemic cells. Black bar represents 50 μm. NS, non-significant; *, P<0.05; **, P<0.01; ***, P<0.001; t-test. Error bars, mean ± SEM (n≥3). For Kaplan-Meier curve, P values were calculated by log-rank test. See also Figure S1; Tables S1–S5.
Figure 2
Figure 2. Identification of Genes and Pathways Related to R-2HG Response
(A) Identification of potential α-KG-dependent dioxygenases and signaling pathways responsible for the varying sensitivities to R-2HG treatment. Upper panel: the top 10 α-KG-dependent dioxygenases showing a positive correlation with R-2HG sensitivity; Lower panel: the top 3 signaling pathways distinguishing sensitive and resistant leukemia cells. (B) Expression of FTO in leukemic samples and healthy controls (mononuclear cells (MNCs), CD34+ cells and CD34 cells) and its positive correlation with R-2HG sensitivity. **, P<0.01; unpaired Student’s t-test. (C) The top 3 signaling pathways suppressed by R-2HG in sensitive (NOMO-1) leukemia cells. (D) Gene set enrichment analysis (GSEA) of differentially expressed genes in four groups of comparisons. (E) The normalized enrichment scores of MYC, G2M, and E2F signaling pathways in the four groups of comparisons. (F) Violin plots summarize the gradient levels MYC, G2M, and E2F signaling cascades in R-2HG resistant, R-2HG sensitive, and healthy control samples. See also Figure S2; Table S6.
Figure 3
Figure 3. R-2HG Induces m6A Modification via Direct Inhibiting m6A Demethylation Activity of FTO
(A) R-2HG treatment (300 μM, 96 hours) increases global m6A levels in sensitive leukemia cells (left panel), but not in resistant cells (right panel). MB, methyl blue. (B and C) Verification of the m6A abundance (B) and determination of m6Am abundance (C) in poly(A)+ RNA by LC-MS/MS. (D) Relative m6A and m6Am abundance in leukemia cells. (E) Identification of the direct binding between R-2HG and FTO via DARTS assays. (F) CETSAs exhibit the binding affinity of R-2HG to FTO in AML cells. (G) Proposed oxidative demethylation of m6A to A in RNA by FTO in the presence of Fe(II), α-KG and R-2HG. (H) Determination of m6A abundance by dot blot in the presence of various R-2HG concentrations and FTO protein in a cell-free system. (I) Verification of the remaining m6A levels in the presence of FTO and varying R-2HG concentrations by LC-MS/MS. w/o, without; w/, with. (J) Effects of FTO on cell proliferation/viability in NOMO-1 cells. (K) Effects of FTO on global m6A modification in NOMO-1 cells. Dot blot assays were conducted with poly(A)+ RNA. (L) Knockdown of FTO abolishes R-2HG-induced cell proliferation-suppressive effects in NOMO-1 cells. *, P<0.05; **, P<0.01; ***, P<0.001; t-test. Error bars, mean ± SD (n=3). See also Figure S3.
Figure 4
Figure 4. R-2HG and FTO Regulate MYC Expression via Manipulation of m6A Modification
(A) The density (line) and frequency (histogram) distributions of m6A peaks in NOMO-1 cells with R-2HG vs. PBS-treatment. (B) The significantly increased (red) or decreased (blue) m6A peaks (P < 0.05) upon R-2HG treatment in NOMO-1 cells. (C) GSEA analysis of genes with a significant increase in m6A modification on transcripts after R-2HG treatment. (D) The m6A abundance in MYC mRNA in R-2HG- or PBS-treated NOMO-1 cells. (E) Gene-specific m6A qPCR validation of m6A level changes of MYC mRNA in NOMO-1 cells. (F) Luciferase reporter and mutagenesis assays. HEK-293T cells were co-transfected with MYC-5′UTR or MYC-CDS bearing wild-type or mutant (m6A replaced by T) m6A motifs, together with wild-type FTO, mutant FTO, or control vector. (G) Luciferase reporter assay-related gene specific m6A qPCR analysis of the m6A levels in the exogenous mRNA transcripts of MYC 5′UTR and CDS. (H) Relative abundance of MYC 5′UTR (upper panel) and CDS (lower panel) exogenous transcripts with wild-type or mutant m6A site in HEK-293T cells. (I) Effects of R-2HG on MYC mRNA stability in sensitive or resistant leukemia cells. (J) Effect of YTHDF2 knockdown on MYC mRNA stability in NOMO-1 and K562 cells. (K) Schematic illustration of m6A-seq in sensitive cells (MA9.3ITD) with FTO knockdown and in resistant cells (MA9.3RAS) with FTO overexpression. (L) Verification of the R-2HG levels in each group being subjected to m6A-seq. (M) Changes of m6A peaks on MYC transcripts in PBS- or R-2HG-treated sensitive cells (MA9.3ITD) upon FTO knockdown, or resistant cells (MA9.3RAS) upon FTO overexpression. (N) Quantitation of the m6A peaks in Figure 4M. (O) Response to R-2HG in NOMO-1 cells with MYC knockdown background. ns, non-significant; *, P<0.05; **P<0.01; ***, P<0.001; t-test. Error bars, mean ± SD (n=3). See also Figure S4.
Figure 5
Figure 5. R-2HG also Indirectly Modulates FTO Expression at Transcriptional Level
(A) Extended R-2HG treatment (300 μM, 96 hours) suppresses FTO expression in sensitive, but not in resistant cells. (B) FTO levels and m6A abundance in NOMO-1 cells treated with PBS or 300 μM R-2HG. (C) Determination of FTO transcription initiation rate via nuclear run-on assay in sensitive NOMO-1 cells upon R-2HG or PBS treatment for 96 hours. (D) Pearson correlation analysis between expression of predicted TFs and FTO in four AML datasets. (E) TFs whose expression shows a positive or negative correlation with FTO across AML datasets. (F and G) m6A modification and quantitation of m6A abundance on mRNA transcripts (F) and relative expression levels (G) of CEBPA and MZF1 in NOMO-1 cells with R-2HG or PBS treatment for 48 hours. (H and I) Effects of FTO on regulating CEBPA expression at the protein (H) and RNA (I) levels in NOMO-1 cells. (J) The effect of R-2HG treatment and YTHDF2 knockdown on the stability of CEBPA mRNA. (K) The effect of YTHDF2 knockdown on FTO and CEBPA expression. (L) Expression of CEBPA in AML and healthy control samples according to GSE24006 dataset. (M) CEBPA enhances transcriptional activity of the FTO promoter as detected by luciferase reporter/mutagenesis assays. (N) Effects of CEBPA knockdown on cell proliferation/viability in NOMO-1 cells. (O) Effects of CEBPA on FTO expression in NOMO-1 cells. (P) Response to R-2HG in NOMO-1 cells with or without CEBPA knockdown. (Q) Model of the anti-leukemic activity of R-2HG through FTO inhibition. In this model, direct interaction between R-2HG and FTO induces global increased m6A modification as well as decreased expression of MYC and CEBPA, which account for the anti-tumor activity of R-2HG; as a feedback mechanism, R-2HG⊣FTO⊣m6A axis-induced down-regulation of CEBPA also decreases FTO expression at transcriptional level. *P<0.05; **, P<0.01; ***, P<0.001; t-test. Error bars, mean ± SD (n=3). See also Figure S5.
Figure 6
Figure 6. Effects of IDH Mutation and S-2HG in Leukemia
(A) Effect of IDH1R132H on FTO and MYC expression in sensitive cells (NOMO-1 and MA9.3ITD) and resistant (K562) cells. (B) Confirmation of the intracellular R-2HG accumulation in IDH1R132H infected cells with Dox induction. ***, P<0.001; t-test. Error bars, mean ± SD (n=3). (C) Effects of IDH1R132H on global m6A modification in poly(A)+ RNA in the sensitive and resistant cells. (D) The chemical structures of α-KG, R-2HG, and S-2HG as well as their potential inhibition on FTO. (E) Effects of S-2HG on cell proliferation/viability in multiple R-2HG sensitive and resistant cells. Upper panel, the cells were treated with 300 μM S-2HG for indicated time points; lower panel, the cells were treated for 96 hours with indicated S-2HG concentrations. (F) m6A dot blot demonstrates that S-2HG also acts as a competitive inhibitor of FTO in a cell-free system. (G) Analysis of the remaining m6A abundance with presence various S-2HG concentrations and FTO via LC-MS/MS. See also Figure S6.
Figure 7
Figure 7. The Abundance of FTO and MYC Control Sensitivity of Leukemic Cells to R-2HG and R-2HG Shows Synergistic Activity with First-line Chemotherapy Drugs
(A) Venn diagram showing the shared signaling pathways of the 4 indicated groups of comparisons. Information of the sensitive, resistant, and healthy control samples is described in Figure 2A. The other samples listed in the plot are human primary AML samples from the TCGA dataset: IDH mutant, AML samples with mutations in IDH1 and/or IDH2; IDH WT, AML samples with wild-type IDH genes; IDH WT (NK) or IDH mutant (NK), normal-karyotype AML samples with wild-type or mutant IDH genes. (B) The IC50 values of JQ1 in AML patients with IDH mutations or wild-type IDH genes. (C) Relative expression levels of MYC, CDK4, CDK6, FTO, and ALKBH5 in primary AML patients with or without IDH mutation as well as in healthy controls (MNCs). (D) The expression pattern of FTO and MYC in sensitive and resistant cells with or without R-2HG treatment for 96 hours. (E) Knockdown of MYC increases the sensitivity to R-2HG in resistant K562 cells. (F) Forced expression of MYC rescues R-2HG-induced (left panel) and IDH1R132H-mediated (middle panel) growth-suppressive effects in sensitive NOMO-1 cells. MYC overexpression was confirmed by Western blot (right panel). (G) Synergistic therapy of R-2HG in combination with Daunorubicin and Decitabine in vivo. NSGS mice were transplanted with NOMO-1 cells and the combined chemotherapy regimens were started on day 11 post xeno-transplantation as indicated in the upper panel. (H) Schematic illustration of the relevant abundance of FTO and MYC controlling R-2HG sensitivity. ns, non-significant; *, P<0.05; **, P<0.01; ***, P<0.001; t-test. Error bars, mean ± SD (n≥3). For Kaplan-Meier curve, P values were calculated by log-rank test. See also Figure S7; Table S4.

Comment in

References

    1. Boutzen H, Saland E, Larrue C, de Toni F, Gales L, Castelli FA, Cathebas M, Zaghdoudi S, Stuani L, Kaoma T, et al. Isocitrate dehydrogenase 1 mutations prime the all-trans retinoic acid myeloid differentiation pathway in acute myeloid leukemia. The Journal of experimental medicine. 2016;213:483–497. - PMC - PubMed
    1. Bralten LB, Kloosterhof NK, Balvers R, Sacchetti A, Lapre L, Lamfers M, Leenstra S, de Jonge H, Kros JM, Jansen EE, et al. IDH1 R132H decreases proliferation of glioma cell lines in vitro and in vivo. Annals of neurology. 2011;69:455–463. - PubMed
    1. Brat DJ, Verhaak RG, Aldape KD, Yung WK, Salama SR, Cooper LA, Rheinbay E, Miller CR, Vitucci M, Morozova O, et al. Comprehensive, Integrative Genomic Analysis of Diffuse Lower-Grade Gliomas. N Engl J Med. 2015;372:2481–2498. - PMC - PubMed
    1. Chou WC, Lei WC, Ko BS, Hou HA, Chen CY, Tang JL, Yao M, Tsay W, Wu SJ, Huang SY, et al. The prognostic impact and stability of Isocitrate dehydrogenase 2 mutation in adult patients with acute myeloid leukemia. Leukemia. 2011;25:246–253. - PubMed
    1. Chowdhury R, Yeoh KK, Tian YM, Hillringhaus L, Bagg EA, Rose NR, Leung IK, Li XS, Woon EC, Yang M, et al. The oncometabolite 2-hydroxyglutarate inhibits histone lysine demethylases. EMBO reports. 2011;12:463–469. - PMC - PubMed

Publication types

MeSH terms