. 2018 Jan 8;28(1):84-92.e4.
doi: 10.1016/j.cub.2017.11.034. Epub 2017 Dec 14.

Mechanisms Connecting the Conserved Protein Kinases Ssp1, Kin1, and Pom1 in Fission Yeast Cell Polarity and Division

Affiliations

Mechanisms Connecting the Conserved Protein Kinases Ssp1, Kin1, and Pom1 in Fission Yeast Cell Polarity and Division

Mid Eum Lee et al. Curr Biol. .

Abstract

Connections between the protein kinases that function within complex cell polarity networks are poorly understood. Rod-shaped fission yeast cells grow in a highly polarized manner, and genetic screens have identified many protein kinases, including the CaMKK-like Ssp1 and the MARK/PAR-1 family kinase Kin1, that are required for polarized growth and cell shape, but their functional mechanisms and connections have been unknown [1-5]. We found that Ssp1 promotes cell polarity by phosphorylating the activation loop of Kin1. Kin1 regulates cell polarity and cytokinesis through unknown mechanisms [4-7]. We performed a large-scale phosphoproteomic screen and found that Kin1 phosphorylates itself and Pal1 to promote growth at cell tips, and these proteins are interdependent for localization to growing cell tips. Additional Kin1 substrates for cell polarity and cytokinesis (Tea4, Mod5, Cdc15, and Cyk3) were also phosphorylated by a second kinase, the DYRK family member Pom1 [8]. Kin1 and Pom1 were enriched at opposite ends of growing cells, and they phosphorylated largely non-overlapping sites on shared substrates. Combined inhibition of both Kin1and Pom1 led to synthetic defects in their shared substrates Cdc15 and Cyk3, confirming a non-redundant functional connection through shared substrates. These findings uncover a new Ssp1-Kin1 signaling pathway, and define its functional and mechanistic connection with Pom1 signaling for cell polarity and cytokinesis. These kinases are conserved in many eukaryotes including humans, suggesting that similar connections and mechanisms might operate in a broad range of cells.

Keywords: Kin1; Pom1; Ssp1; cytokinesis; kinase; polarity; pombe; yeast.


Figures

Figure 1
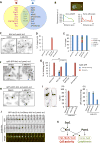
Figure 1. Ssp1 promotes cell polarity by phosphorylating the activation loop of Kin1
(A) Sequence alignment of activation loops from the indicated MARK/PAR-1 and AMPK-related kinases. Black letters represent invariant residues; asterisk denotes phosphorylated threonine. (B) Kin1-pT299 is absent in ssp1Δ mutant. Whole-cell extracts from the indicated strains were separated by SDS-PAGE, and probed by western blot with the indicated antibodies. Asterisk denotes background band. (C) In vitro thiophosphate kinase assay showing direct phosphorylation of Kin1 by Ssp1-as1. Ssp1-as1 was purified from bacteria; kin1-mEGFP was immunoprecipitated from kin1-mEGFP ssp1Δ cells. Phosphorylation is detected by anti-thiophosphate ester antibody (α-ThioP). (D) Actin staining of wild-type and kin1-T299A mutant. F-actin was visualized with Alexa Fluor-488 phalloidin staining. Maximum projection images are shown. Scale bar, 5μm. (E) Quantification of polarity patterns from actin staining of kin1+ and kin1(T299A) strains. Values are mean ± standard deviation from 3 independent experiments (n > 150 cells each). **, P < 10−2. (F) Actin staining of cdc25-22 or kin1-T299A cdc25-22 cells grown to log phase at 25°C and then shifted to 36°C for 4 hours. Cells were fixed, and stained with Alexa Fluor-488 phalloidin before imaging. Brackets indicate medial 10 μm section used for quantifying actin patch numbers. Scale bar, 5μm. (G) Quantification of polarity patterns from actin staining of cdc25-22 and kin1-T299A cdc25-22 mutant arrested at 36°C for 4 hours. Values are mean ± standard deviation from 3 independent experiments (n > 150 cells each). (H) Quantification of F-actin patches within 10 μm medial region of cells from panel F. Values are mean ± standard deviation from 10 cells. ***, P < 10−5. See also Figure S1.
Figure 2
Figure 2. Phosphoproteomic identification of Kin1 substrates
(A) Images of analog-sensitive kin1-as1 cells treated with DMSO (control) or 2 μM 3-MB-PP1 for 14 hours at 32°C. Cells were stained with blankophor to mark cell walls. kin1Δ cells are shown on the right for comparison. Scale bars, 5μm. (B) SDS-PAGE band shifts for kin1-as1-mEGFP when inhibited by 3-MB-PP1 for the indicated time points. Samples are whole-cell extracts. Asterisk denotes background bands. The Kin1 intensity profiles along each lane for 15 min time point is shown on the right. a.u., arbitrary units. (C) Schematic summary of Kin1 structure and phosphorylation sites from our phosphoproteomic screen. Black residues were Kin1-dependent, green residues were unaffected by Kin1 inhibition (see also Table S1). KA1: Kinase associated-1 domain. (D) In vitro thiophosphate kinase assay using kin1-as1-mEGFP immunoprecipitated from S. pombe. Phosphorylation is detected by α-ThioP; 3-MB-PP1 inhibits Kin1-as1-mEGFP. (E) SDS-PAGE band shift for kin1(16A)-mEGFP. Samples are whole-cell extracts. The Kin1 intensity profiles along each lane is shown on the right. a.u., arbitrary units. Note that mutant migrates faster than wild type. (F) Localization and phenotype of kin1(16A)-mEGFP. Both GFP and DIC images are shown. Wild type kin1-mEGFP cells are shown on the right for comparison (see also Figure S2H). Scale bar, 5μm. (G) Schematic summary of Kin1 phosphorylation sites on Pal1, Mod5 and Tea4. Black lines mark in vivo Kin1-dependent phosphorylation sites. Green lines mark sites that were phosphorylated by wild-type Kin1 but not by kinase-dead Kin1 in vitro. Blue lines mark sites mapped by both in vivo and in vitro assays (see also Table S1 and S3). Protein domains are marked with grey bars for each protein, and the fragments purified for Mod5 and Tea4 are underlined in black. (H-J) In vitro thiophosphate kinase assay using kin1-as1-mEGFP immunoprecipitated from S. pombe. Substrates Pal1, Tea4(113-436) and Mod5(28-495) were purified from bacteria. Phosphorylation is detected by α-ThioP; 3-MB-PP1 inhibits Kin1-as1-mEGFP. See also Figure S2 and Tables S1-S3.
Figure 3
Figure 3. Interdependent localization of Kin1 and its substrate Pal1
(A) Localization of pal1-mEGFP in wild-type (kin1+) and kin1Δ cells. Scale bars are 5 μm in all panels of this figure. (B) pal1-mEGFP localization in kin1-as1 cells treated with DMSO or 15μM 3-MB-PP1 for 1 hour before imaging. Graph shows quantification of Pal1 localization defect (n>100 cells each). (C) Localization of pal1(7A)-mEGFP mutant lacking Kin1-dependent phosphorylation sites. See panel A for localization of wild type pal1-mEGFP. Graph shows quantification of pal1(7A) localization defect (n>180 cells each). (D) Localization of kin1-mEGFP in pal1Δ cells. Graph shows quantification of Kin1 localization defect for the indicated strains (n>100 cells each). (E) Schematic summary of Kin1 structure-function analysis. The conserved KA1 domain is grey, the kinase domain is black, and the critical middle region is yellow. Numbers indicate the amino acids in each truncation mutant. Each construct was assessed for localization to the cell ends, the cell sides, and the division septum. Cell morphology was used to test function. (F) Localization of kin1-mEGFP and kin1(ΔKA1)-mEGFP in cells. Kin1(ΔKA1) consists of amino acids 1-752. See panel D for quantification. (G) Localization of kin1(ΔKA1)-mEGFP in pal1 cells and pal1(7A) mutant. (H) Quantification of BiFC experiments for the indicated strains. The percentage of cells with YFP fluorescence was quantified, and data show mean ± standard deviations from 3 independent experiments (n > 100 cells each). VC, C-terminal half of Venus; VN, N-terminal half of Venus. (I) GST-kin1(511-752) and GST alone expressed and purified from bacteria, as described in STAR Methods. CBB, coomassie brilliant blue. (J) In vitro binding assay shows Pal1-mEGFP binds to GST-kin1(511-752) but not to GST alone. pal1(7A) mutation does not impair this interaction. See also Figure S3.
Figure 4
Figure 4. Kin1 and Pom1 kinase share cell polarity and cytokinesis substrates
(A) Selected substrates of Kin1 and Pom1, identified from independent phosphoproteomic screens. Overlapping substrates are shown in the middle in green. (B) Localization of Kin1 and Pom1 in an interphase kin1-mEGFP pom1-tdTomato cell. Graphs show fluorescence intensity for each protein along the cell length (see also Figure S4B). (C) Phenotypes of kin1-as1 pom1-as1 double mutant treated for 4 hours at 32°C with DMSO control or 10 μM 3-MB-PP1. Cells were stained with blankophor before imaging. Arrowheads indicate T-shaped cells, asterisks indicate aberrant septa. Scale bar, 5 μm. (D) Quantification of T-shaped cells in the indicated strains treated for 4 hours at 32°C with 10 μM 3-MB-PP1. Values are mean ± standard deviations from 3 independent experiments (n > 200 cells each). (E) Quantification of septation defects in the indicated strains treated as in panel C. Categories of septation defects are shown on the right (n >100 cells each). (F) Localization of cyk3-GFP in kin1-as1 pom1-as1 mutants after treatment with DMSO or 15 μM 3-MB-PP1 for one hour. Arrowheads indicate Cyk3-GFP signals at the cell tips with a Cyk3 ring in the middle. Scale bar, 5 μm. (G) Quantification of cyk3-GFP localization pattern in dividing cells of the indicated strains, treated as in panel F. Values are mean ± standard deviation from three independent experiments (n>35 dividing cells each). *, p < 0.02; **, p < 10−6. (H) Localization of GFP-cdc15 in kin1-as1 pom1-as1 mutants after treatment with DMSO or 15 μM 3-MB-PP1 for one hour. Arrowheads indicate aberrant GFP-cdc15 rings. Scale bar, 5 μm. (I) Left: maximum projection images from deconvolved z-series of aberrant GFP-cdc15 “lasso” rings from two kin1-as1 pom1-as1 cells treated with 15μM 3-MB-PP1 for one hour. Scale bar, 3 μm. Cells are outlined in red. Middle: percentage of cells with GFP-cdc15 lassos from the indicated strains treated with 15μM 3-MB-PP1 for one hour. Values are mean ± standard deviations from 3 independent experiments (n > 40 cells each). Right: percentage of cells with GFP-cdc15 off-centered rings from the indicated strains treated with 15μM 3-MB-PP1 for one hour (n > 50 cells). (J) Time-lapse images of GFP-cdc15 and rlc1-mCherry in kin1-as1 pom1-as1 cells treated with 15μM 3-MB-PP1 treatment for one hour before imaging. Time is indicated in minutes. Scale bar, 3 μm. (K) Schematic diagram for convergence of Ssp1➔Kin1 pathway and Pom1 pathway in cell polarity and cytokinesis signaling. See also Figure S4 and Table S3.

References

    1. Verde F, Mata J, Nurse P. Fission yeast cell morphogenesis: identification of new genes and analysis of their role during the cell cycle. The Journal of cell biology. 1995;131:1529–1538. - PMC - PubMed
    1. Bahler J, Pringle JR. Pom1p, a fission yeast protein kinase that provides positional information for both polarized growth and cytokinesis. Genes & development. 1998;12:1356–1370. - PMC - PubMed
    1. Koyano T, Kume K, Konishi M, Toda T, Hirata D. Search for kinases related to transition of growth polarity in fission yeast. Bioscience, biotechnology, and biochemistry. 2010;74:1129–1133. - PubMed
    1. Drewes G, Nurse P. The protein kinase kin1, the fission yeast orthologue of mammalian MARK/PAR-1, localises to new cell ends after mitosis and is important for bipolar growth. FEBS letters. 2003;554:45–49. - PubMed
    1. Levin DE, Bishop JM. A putative protein kinase gene (kin1+) is important for growth polarity in Schizosaccharomyces pombe. Proceedings of the National Academy of Sciences of the United States of America. 1990;87:8272–8276. - PMC - PubMed

Publication types

MeSH terms

LinkOut - more resources