. 2018 Jan 9;10(1):101-119.
doi: 10.1016/j.stemcr.2017.11.012. Epub 2017 Dec 14.

In Vitro Induction and In Vivo Engraftment of Lung Bud Tip Progenitor Cells Derived from Human Pluripotent Stem Cells

Affiliations

In Vitro Induction and In Vivo Engraftment of Lung Bud Tip Progenitor Cells Derived from Human Pluripotent Stem Cells

Alyssa J Miller et al. Stem Cell Reports. .

Abstract

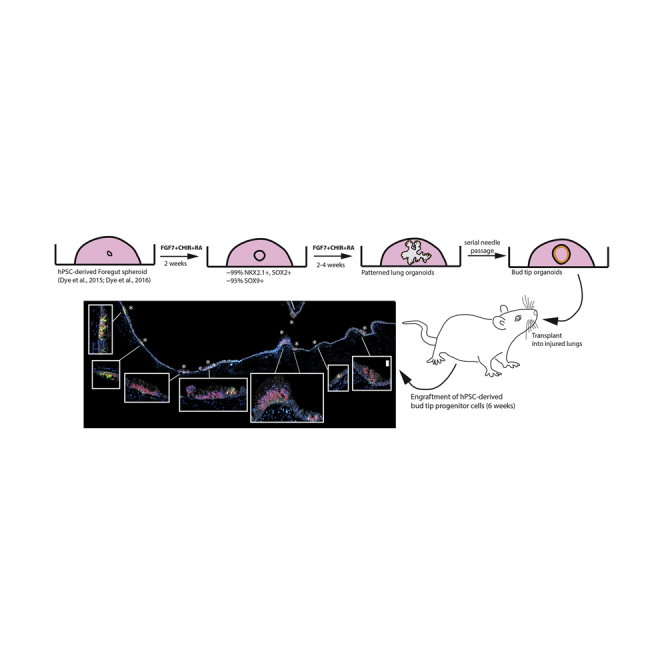
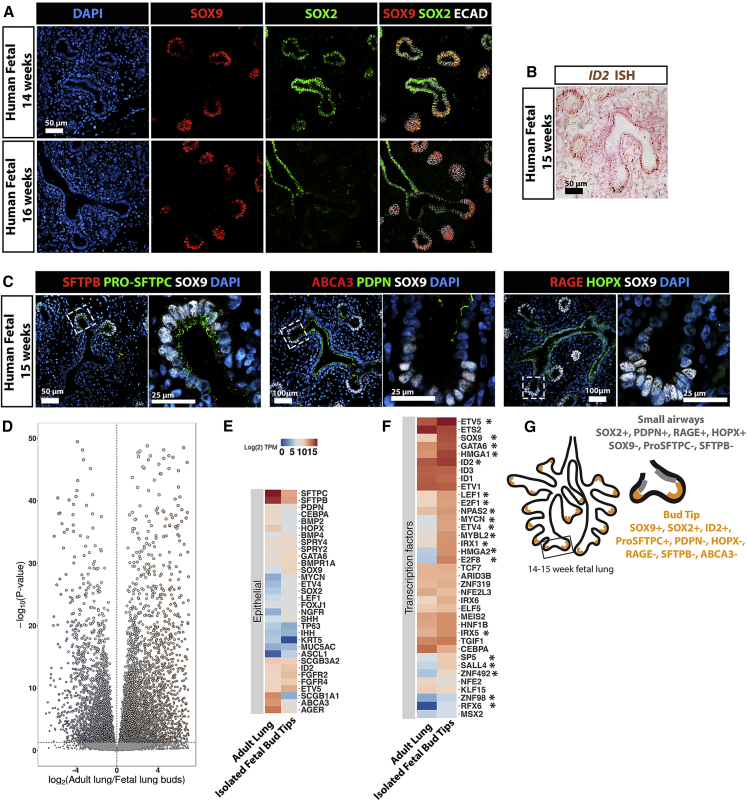
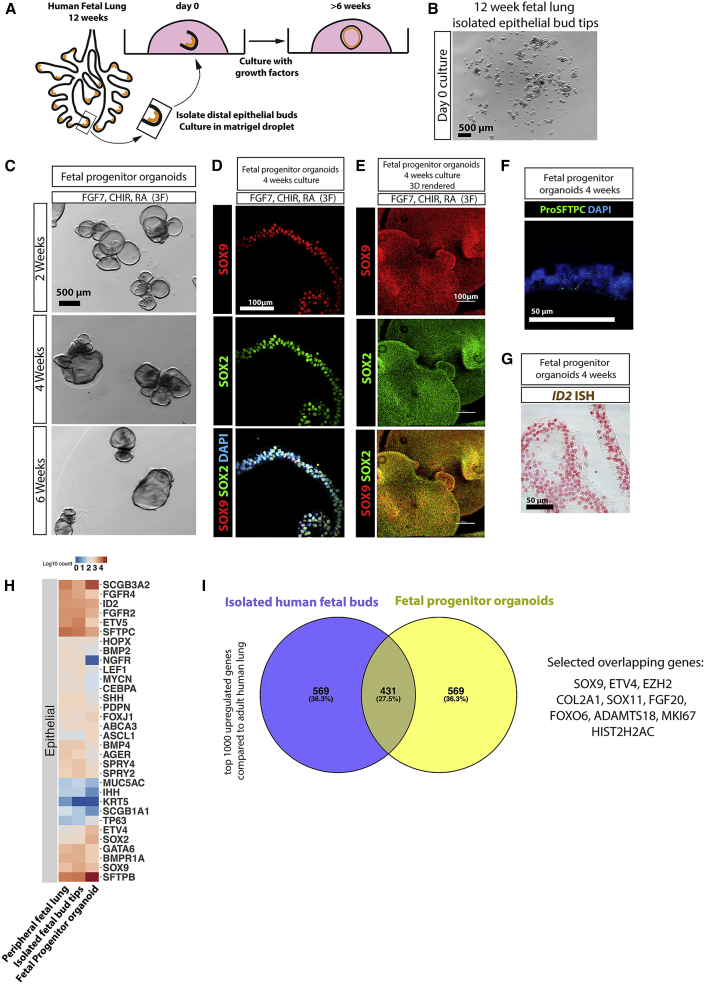
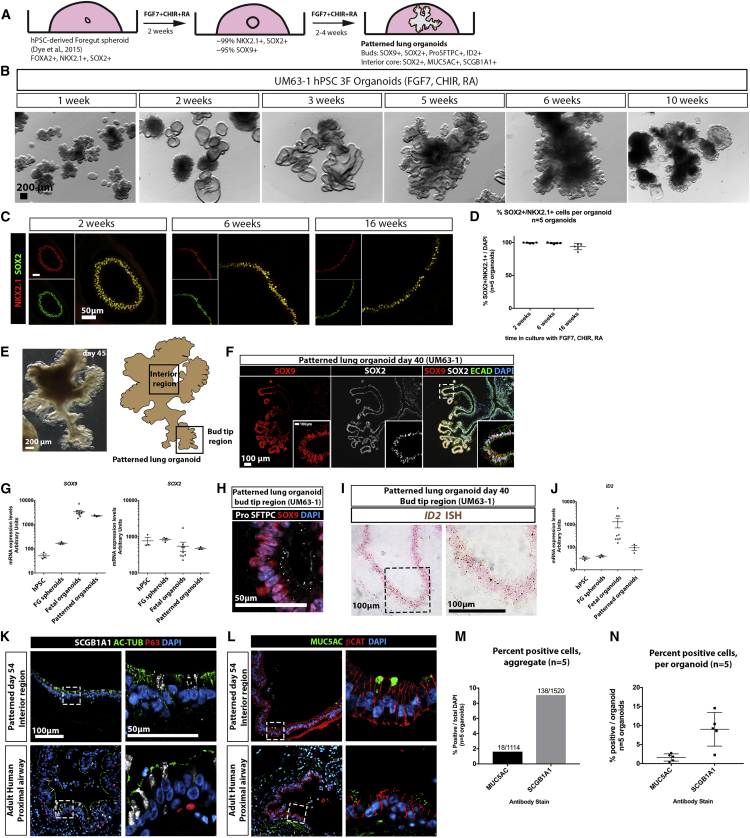
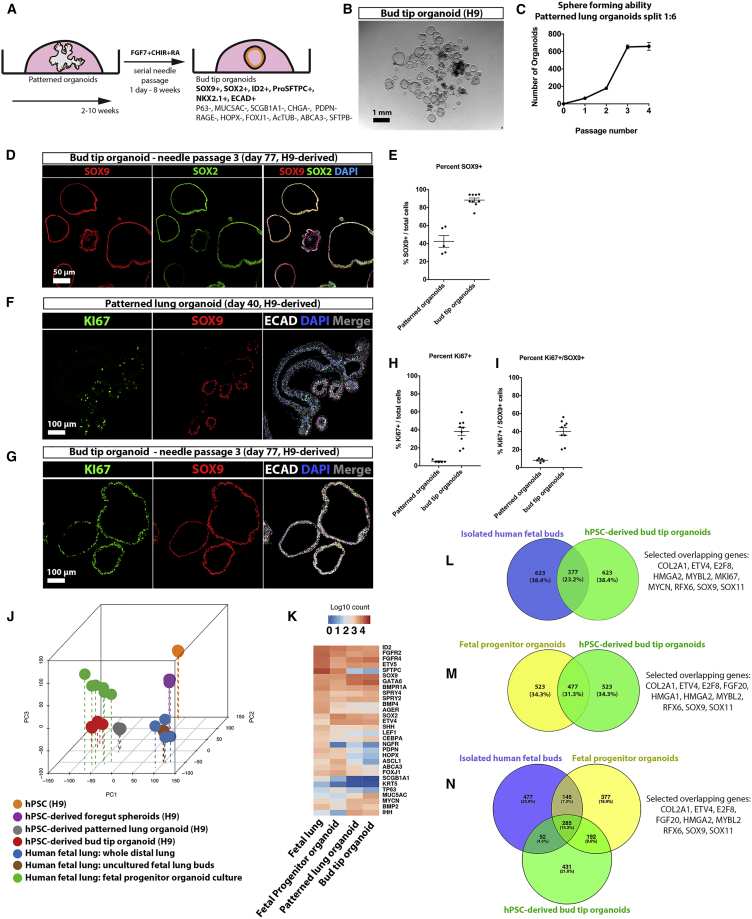
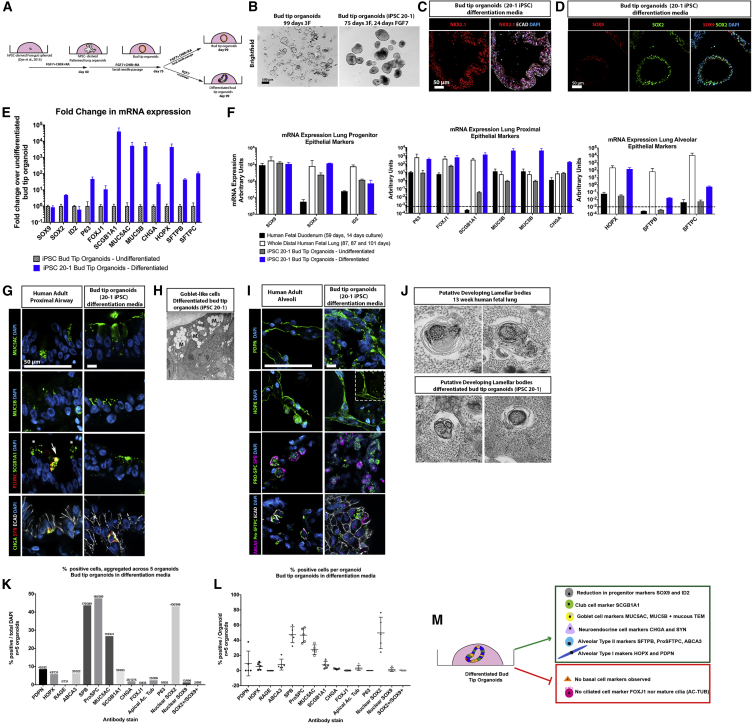
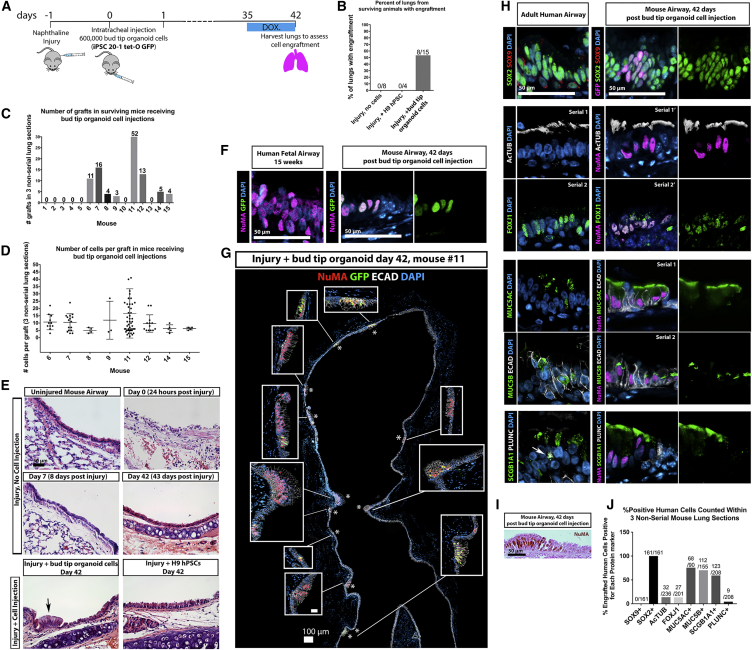
The current study aimed to understand the developmental mechanisms regulating bud tip progenitor cells in the human fetal lung, which are present during branching morphogenesis, and to use this information to induce a bud tip progenitor-like population from human pluripotent stem cells (hPSCs) in vitro. We identified cues that maintained isolated human fetal lung epithelial bud tip progenitor cells in vitro and induced three-dimensional hPSC-derived organoids with bud tip-like domains. Bud tip-like domains could be isolated, expanded, and maintained as a nearly homogeneous population. Molecular and cellular comparisons revealed that hPSC-derived bud tip-like cells are highly similar to native lung bud tip progenitors. hPSC-derived epithelial bud tip-like structures survived in vitro for over 16 weeks, could be easily frozen and thawed, maintained multilineage potential, and successfully engrafted into the airways of immunocompromised mouse lungs, where they persisted for up to 6 weeks and gave rise to several lung epithelial lineages.

Keywords: SOX2; SOX9; branching morphogenesis; bud tip; directed differentiation; human pluripotent stem cell; lung; lung organoid; organoid; progenitor.


Figures

None
Graphical abstract
Figure 1
Figure 1
Characterization of Bud Tip Progenitors from 14 to 16 Weeks of Human Fetal Lung Development (A) Expression of SOX2 and SOX9 in human fetal lungs at 14 and 16 weeks of gestation. Scale bar represents 50 μm. (B) Expression of ID2 in human fetal lungs at 15 weeks gestation as identified by in situ hybridization. Scale bar represents 50 μm. (C) Expression of SOX9 along with pro-SFTPC, SFTPB, PDPN, HOPX, ABCA3, or RAGE in human fetal lung at 15 weeks. Scale bars represent 50 μm (low-magnification images) and 25 μm (high-magnification images). (D) Volcano plot of differentially expressed genes identified by comparing isolated, uncultured human fetal bud tips (n = 2 biological replicates; 8 and 12 weeks gestation) with whole adult human lung (publically available dataset). A total of 7,166 genes were differentially expressed (adjusted p value < 0.01). (E) Heatmap showing expression of genes known to be expressed lung epithelial cells in isolated human fetal bud tips and whole adult human lung. (F) Heatmap showing expression of 37 human bud-tip enriched transcription factors (Nikolić et al., 2017) in isolated human fetal bud tips and whole adult human lung. Twenty of the 37 transcription factors () were statistically significantly enriched in isolated fetal bud tips. (G) Summary of markers expressed by bud tip cells in regions adjacent to the bud tips at 14–15 weeks gestation as identified by protein staining and in situ hybridization.
Figure 2
Figure 2
FGF7, CHIR-99021, and RA Are Sufficient to Maintain Isolated Human Fetal Bud Tip Progenitor Cells In Vitro (A and B) Distal epithelial lung bud tips were isolated and cultured in Matrigel droplets. Scale bar represents 500 μm in (B). (C). Whole-mount bright-field image of human fetal organoids grown in “3F” medium (FGF7, CHIR-99021, and RA) at 2, 4, and 6 weeks. Scale bar represents 500 μm. (D) Protein staining of SOX2 and SOX9 in sections of fetal progenitor organoids grown in 3F medium. Scale bar represents 100 μm. (E) Whole-mount staining, confocal z stack imaging, and 3D rendering of SOX2 and SOX9 in fetal progenitor organoids grown in 3F medium. Scale bar represents 100 μm. (F) Pro-SFTPC after 4 weeks in culture in fetal progenitor organoids. Scale bars represent 50 μm. (G) ID2 expression in fetal progenitor organoids after 4 weeks in culture as determined by in situ hybridization. Scale bar represents 50 μm. (H) Heatmap showing expression of genes known to be expressed lung epithelial cells in the whole adult human lung (publically available dataset), in isolated human fetal bud tips (n = 2; 8 and 12 weeks gestation) and in fetal progenitor organoids (n = 2; both 12 weeks gestation, cultured for 2 weeks). (I) Differential expression analysis (isolated fetal epithelial bud tips versus whole adult lung; fetal progenitor organoids versus whole adult lung) was used to identify the top 1,000 most highly upregulated genes from each comparison (log2 fold change < 0; adjusted p value < 0.05). Gene overlap was identified using a Venn diagram. Of all genes, 27.5% were common to both groups. A hypergeometric means test showed that the number of overlapping genes was highly significant (overlapping p value = 1.4 × 10−278).
Figure 3
Figure 3
FGF7, CHIR-99021, and RA Generate Patterned Epithelial Lung Organoids from hPSCs (A) Schematic of approach to derive patterned lung organoids (PLOs) from human pluripotent stem cells. (B) Bright-field images of hPSC-derived foregut spheroids cultured in 3F medium (FGF7, CHIR-99021, and RA) and grown in vitro. Images taken at 2, 3, 5, 6, and 10 weeks. Images from a single experiment, representative of 6 experiments across 4 hPSC cell lines. Scale bars represent 200 μm. (C) Immunostaining for NKX2.1 and SOX2 in PLOs at 2, 6, and 16 weeks. Scale bars represent 50 μm. (D) Quantitative analysis of cells co-expressing NKX2.1 and SOX2 in PLOs at 2, 6, and 16 weeks, as shown in (B). Each data point (n = 5) represents a single organoid from one experiment, and the mean ± SEM is shown for each group. Data are representative of 6 experiments with 4 different cell hPSC lines. (E) Bright-field image of a patterned lung organoid after 6 weeks (45 days) in culture, showing distal budded regions and interior regions, and a schematic representing a patterned lung organoid, highlighting bud tip region and interior regions. Scale bar represents 200 μm. (F) PLOs co-stained for SOX9 and SOX2 protein expression by immunofluorescence. Inset: high magnification of boxed region. Scale bar represents 100 μm. (G) qRT-PCR analysis of SOX9 and SOX2 in undifferentiated hPSCs (H9 hESC line, n = 3 independent samples from one experiment), in foregut spheroids (FG; n = 3 independent samples obtained from one experiment; each sample contains ≥25 pooled spheroids), fetal progenitor organoids (n = 3 biological replicates [12, 12, and 13 weeks] and 3 technical replicates each) and patterned lung organoids (n = 3 independent samples obtained from 1 experiment; each sample contained ≥3 pooled organoids). Data are representative of 6 experiments with 4 different cell hPSC lines. (H) Pro-SFTPC and SOX9 co-expression in bud tip region of a PLO. Scale bars represent 50 μm. (I) ID2 expression in PLOs after 40 days in vitro as determined by in situ hybridization. Scale bar represents 100 μm. (J) qRT-PCR analysis of ID2 in undifferentiated hPSCs in undifferentiated hPSCs (H9 hESC line, n = 3 independent samples from 1 experiment), in foregut spheroids (FG; n = 3 independent samples obtained from 1 experiment; each sample contains ≥25 pooled spheroids), fetal progenitor organoids (n = 3 biological replicates [12, 12, and 13 weeks] with 3 technical replicates each) and patterned lung organoids (n = 3 independent samples obtained from 1 experiment; each sample contained ≥3 pooled organoids). Data are representative of 6 experiments with 4 different cell hPSC lines. (K) Interior regions of patterned lung organoids (top) and adult human airway (bottom) co-stained for SCGB1A1, acetylated tubulin (AC-TUB) and P63. Scale bars represent 100 μm (left panels, low magnification) or 50 μm (right panels, high magnification). (L) Interior regions of patterned lung organoids (top) and adult human airway (bottom) co-stained for MUC5AC and the epithelial marker β-catenin (βCAT). Scale bar in (K) also applies to images in (L); scale bars represent 100 μm (left panels, low magnification) or 50 μm (right panels, high magnification). (M and N) Percent of cells expressing MUC5AC or SCGB1A1, plotted as aggregate data (number of cells positive in all organoids/total cells counted in all organoids) (M), and for each individual patterned lung organoid counted (number of cells positive in individual organoid/all cells counted in individual organoid) (N). N = 5 organoids for each graph, from a single experiment of organoids derived from UM63-1 hPSC line. Data are representative of 6 experiments across 4 hPSC lines.
Figure 4
Figure 4
Proliferative SOX9+/SOX2+ Progenitors Can Be Expanded from Patterned Lung Organoids (A) Schematic of approach passage PLOs and expand bud tip organoids. (B) Needle-sheared epithelial fragments were replated in a fresh Matrigel droplet that subsequently formed cystic structures, called “bud tip organoids.” Scale bar represents 1 mm. (C) Quantitative assessment of organoid passaging and expansion. One single patterned lung organoid was needle passaged into 6 wells (passage 1), generating 75 new bud tip organoids in total (average 12.5 per well). A single well of the resulting bud tip organoids was then passaged into 6 new wells after 2 weeks in culture (1:6 split ratio), generating 200 new organoids in total (average 33 per well). This 1:6 passaging was carried out two additional times, every 1–2 weeks for up to 4 passages before growth plateaued. Three technical replicates were performed for expansion experiments using patterned lung organoids generated from the UM63-1 hPSC line; the graph plots the mean ± SEM. Data are representative of 6 experiments across 4 hPSC lines. (D) Immunostaining for SOX9 and SOX2 in bud tip organoids. Scale bar represents 50 μm. (E) Quantitation of the percent of SOX9+ cells in PLOs and bud tip organoids (number of SOX9+ cells/total cells). Each data point represents an independent organoid (n = 5 organoids) derived from a single experiment using H9 hPSC line and graphs indicate the mean ± SEM for each experimental group. Data are representative of 6 experiments across 4 hPSC lines. (F and G) Immunostaining for KI67 and SOX9 in patterned lung organoids (F) and bud tip organoids (G). Scale bar represents 100 μm. (H) Quantitation of the percent of all cells that were KI67+ in patterned and bud tip organoids (number of KI67+ cells/total cells). (I) Quantitation of the percent of proliferating SOX9+ cells in patterned and bud tip organoids (number of KI67+/SOX9+ cells/total cells). (H and I) Each data point represents an independent organoid (n = 5 patterned lung organoids and n = 9 bud tip organoids) derived from a single experiment using H9 hPSC line and graphs indicate the mean ± SEM for each experimental group. Data are representative of 6 experiments across 4 hPSC lines. (J) Principal component analysis of RNA-seq data to compare the global transcriptome of hPSCs (n = 3 independent replicates of H9 hPSCs), foregut spheroids (n = 3 independent replicates of H9 hPSCs-derived spheroids. Each replicate contained ≥25 pooled spheroids), hPSC-derived patterned lung organoids (n = 3 independent replicates of H9 hPSCs-derived patterned lung organoids; each replicate contained n ≥ 3 pooled organoids), hPSC-derived bud tip organoids (n = 3 independent replicates of H9 hPSCs-derived bud tip organoids; each replicate contained n ≥ 3 organoids), whole peripheral (distal) fetal lung (n = 3; 8, 12, and 18 weeks), freshly isolated (uncultured) fetal lung buds (n = 2; 8 and 12 weeks gestation) and fetal progenitor organoids (n = 2; both 12 weeks gestation and cultured for 2 weeks). All biological replicates were run in technical triplicate. (K) Heatmap showing expression of genes known to be expressed in lung epithelial cells in freshly isolated (uncultured) fetal lung buds and fetal progenitor organoids cultured for 2 weeks. (L–N) Differential expression analysis of (1) isolated fetal bud tips versus whole adult lung, (2) fetal progenitor organoids versus whole adult lung, and (3) bud tip organoids versus whole adult lung was used to identify the top 1,000 most highly upregulated genes from each comparison (log2 fold change < 0; adjusted p value < 0.05). A Venn diagram illustrates common upregulated genes in (L) isolated bud tips and bud tip organoids, (M) fetal progenitor organoids and bud tip organoids, (N) isolated bud tips, fetal progenitor organoids, and bud tip organoids. (L) hypergeometric means test found that the shared gene overlap was highly significant (overlapping p value = 9.3e-901). (M) Hypergeometric means test found that the shared gene overlap was highly significant (overlapping p value = 1.2e-1,021). (N) A total of 285 overlapping genes were shared between the three groups. These genes represented 14.3% of all genes included in the comparison. A small subset of genes previously associated with human or mouse bud-tip progenitor cells are highlighted as “Selected overlapping genes” (L–N).
Figure 5
Figure 5
Bud Tip Organoids Retain Multilineage Potential In Vitro (A) Schematic of experimental setup. iPSC20-1 bud tip organoids were initially cultured in 3F medium and subsequently grown in 3F medium or medium containing FGF7 alone (“differentiation media”) for 24 days. (B) Bright-field images of bud tip organoids growing in 3F medium (left) or FGF7-differentiation medium (right). Scale bar represents 500 μm. (C) NKX2.1 immunofluorescence of bud tip organoids grown in FGF7-differentiation medium for 24 days. Scale bar represents 50 μm. (D) SOX9 and SOX2 immunofluorescence of bud tip organoids grown in FGF7-differentiation medium for 24 days. Scale bar represents 50 μm. (E) qRT-PCR analysis of bud tip organoids grown in 3F or FGF7-differentiation medium showing expression of several genes expressed in the lung epithelium. Data are shown as fold change relative to 3F-grown undifferentiated bud tip organoids. Each data point represents an independent sample (n = 3) obtained from one experiment derived from iPSC 20-1 hPSC line; each sample contained ≥3 pooled organoids. Data are representative of 5 experiments across 2 hPSC lines (iPSC20-1 and H9). (F) qRT-PCR analysis of bud tip organoids grown in 3F or FGF7-differentiation medium, along with whole distal fetal lung and cultured whole fetal intestine as reference tissues, showing expression of several genes expressed in the lung epithelium. Data are shown as a.u. Values lower than 10−3 were considered undetected. Each data point in bud tip organoid groups represents an independent sample (n = 3) obtained from one experiment derived from iPSC 20-1 hPSC line; each sample contained ≥3 pooled organoids. Data are representative of 5 experiments across 2 hPSC lines (iPSC20-1 and H9). Whole human distal lung samples (n = 3) were taken from 87, 87, and 101 day gestation, and 3 independent samples of human fetal duodenum tissue were used as a comparison. (G) Immunostaining for airway markers in the adult human lung, and in bud tip organoids grown in FGF7-differentiation medium. Markers are shown for goblet cells (MUC5AC, MUC5B), club cells (SCGB1A1, PLUNC), and neuroendocrine cells (synaptophysin [SYN], CHGA). Scale bars represents 50 μm. (H) Transmission electron microscopy through a bud tip organoid grown in FGF7-differentiation medium showing mucus-filled vacuoles characteristic of goblet cells. Scale bar represents 100 nm. (I) Immunostaining for alveolar markers in the adult human lung, and in bud tip organoids grown in FGF7-differentiation medium. Markers are shown for AECI cells (PDPN, HOPX) and AECII cells (pro-SFTPC, SFTPB, ABCA3). Scale bars represent 50 μm. (J) Transmission electron microscopy of a human fetal lung at 13 weeks of gestation, and of a bud tip organoid grown in FGF7-differentiation medium showing immature lamellar bodies surrounded by monoparticulate glycogen, characteristic of immature AECII cells. Scale bars represent 100 nm. (K and L) Quantitation of cell type markers in bud tip organoids grown in differentiation medium plotted as aggregate data (numbers at top of bars represent positive cells/total cells counted across five individual organoids) (H), and as individual data per organoid (number of positive cells per organoid) (I). Graphs indicate the mean ± SEM. Data are from a single differentiation experiment derived from iPSC 20-1 hPSC line and each data point represents an individual organoid (n = 5 organoids). Data are representative of five experiments across two hPSC lines (iPSC20-1 and H9). (M) Summary of putative differentiated lung epithelial cell types generated in vitro.
Figure 6
Figure 6
Engraftment of hPSC-Derived Bud Tip Progenitor Organoid Cells into the Injured Mouse Airway (A) Schematic of experimental design. Immunocompromised NSG male mice were injected with 300 mg/kg of naphthalene. Twenty-four hours post injury, mice were randomly assigned to receive an intratracheal injection of 600,000 single cells isolated from bud tip organoids generated from the iPSC 20-1 tet-O GFP line, undifferentiated H9 hPSCs, or no injection of cells. Doxycycline (1 mg/mL) was added to the drinking water for the final week to induce expression of the tet-O GFP construct. Lungs were analyzed 6 weeks after cell injection. (B) Percent of lungs from surviving animals in each group exhibiting engraftment of human cells after 6 weeks, as determined by NuMA and GFP protein staining. (C and D) Engraftment was assessed based on human-specific expression on NuMA and GFP in three independent histological sections from each surviving mouse. (C) The number of engraftment cell patches observed in 15 surviving animals in the group receiving bud tip organoid cells. (D) Quantitation of the number of human cells in each engrafted cell patch, in each mouse. Every data point represents the number of cells in a single patch of cells. (E) H&E staining documenting the lung epithelial airway injury in control mice (injury, no cell injection), and in mice that received bud tip organoids, or undifferentiated iPSC injections. Engrafted patches of human cells were obvious (arrow), and were confirmed in serial sections using human-specific antibodies. Scale bar represents 50 μm for all images. (F) Immunostaining for NuMA and GFP in human fetal lungs and in bud tip organoid transplanted lungs. Scale bar represents 50 μm. (G) Bud tip organoid transplanted lung showing several images stitched together to generate a large panel demonstrating multiple sites of engraftment (denoted by asterisks), marked by NuMA and/or GFP, in the upper airway. High-magnification insets are shown. Scale bar represents 100 μm. (H) Immunostaining of adult human lung tissue and bud tip organoid transplanted lung tissue showing immunostaining for several lung epithelial markers, including SOX9 and SOX2, multiciliated cell markers AC-TUB and FOXJ1, goblet cell markers MUC5AC and MUC5B, club cell markers SCGB1A1 and PLUNC. Arrow highlights a cell co-expressing SCGB1A1/PLUNC. Scale bar represents 50 μm. (I) Bright-field microscopic image showing immunohistochemistry for NuMA in a patch of engrafted cells, counterstained using eosin to visualize tufts of multiple cilia. Scale bar represents 50 μm. (J) Quantification of cell type markers in bud tip organoid transplanted lungs after 6 weeks. Data are plotted as aggregate data (numbers at top of bars represent positive cells/total cells counted across three engrafted lungs). Aggregated data from three non-serial sections for mouse 7, 11, and 12 is plotted.

Similar articles

Cited by

References

    1. Badri L., Walker N.M., Ohtsuka T., Wang Z., Delmar M., Flint A., Peters-Golden M., Toews G.B., Pinsky D.J., Krebsbach P.H., Lama V.N. Epithelial interactions and local engraftment of lung-resident mesenchymal stem cells. Am. J. Respir. Cell Mol. Biol. 2011;45:809–816. - PMC - PubMed
    1. Branchfield K., Li R., Lungova V., Verheyden J.M., McCulley D., Sun X. A three-dimensional study of alveologenesis in mouse lung. Dev. Biol. 2015;409:429–441. - PMC - PubMed
    1. Cao P., Aoki Y., Badri L., Walker N.M., Manning C.M., Lagstein A., Fearon E.R., Lama V.N. Autocrine lysophosphatidic acid signaling activates β-catenin and promotes lung allograft fibrosis. J. Clin. Invest. 2017;127:1517–1530. - PMC - PubMed
    1. Chang D.R., Martinez Alanis D., Miller R.K., Ji H., Akiyama H., McCrea P.D., Chen J. Lung epithelial branching program antagonizes alveolar differentiation. Proc. Natl. Acad. Sci. USA. 2013;110:18042–18051. - PMC - PubMed
    1. Chen Y.-W., Huang S.X., de Carvalho A.L.R.T., Ho S.-H., Islam M.N., Volpi S., Notarangelo L.D., Ciancanelli M., Casanova J.-L., Bhattacharya J. A three-dimensional model of human lung development and disease from pluripotent stem cells. Nat. Cell Biol. 2017;19:542–549. - PMC - PubMed

Publication types