. 2018 Jan 9;27(1):136-150.e5.
doi: 10.1016/j.cmet.2017.11.001. Epub 2017 Dec 14.

JAK/STAT3-Regulated Fatty Acid β-Oxidation Is Critical for Breast Cancer Stem Cell Self-Renewal and Chemoresistance

Affiliations

JAK/STAT3-Regulated Fatty Acid β-Oxidation Is Critical for Breast Cancer Stem Cell Self-Renewal and Chemoresistance

Tianyi Wang et al. Cell Metab. .

Erratum in

Abstract

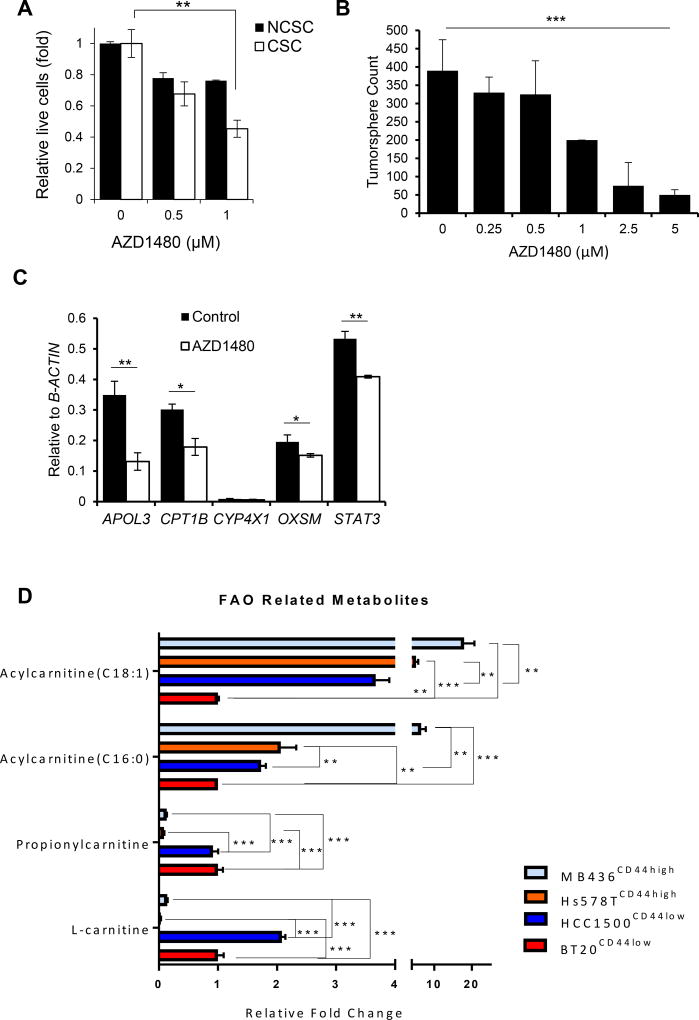
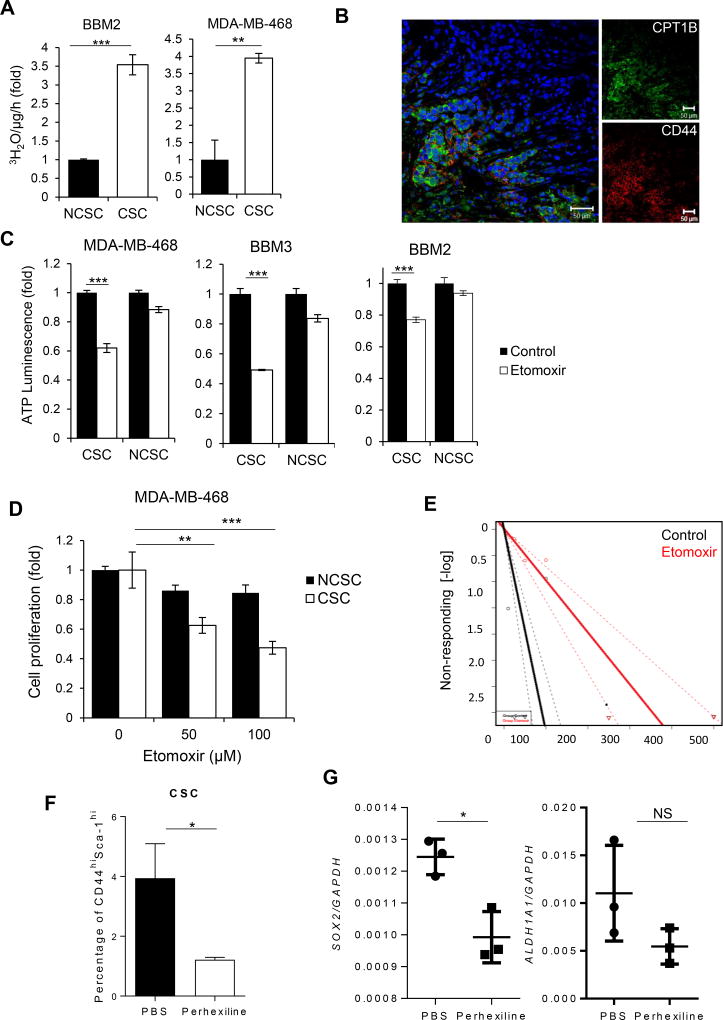
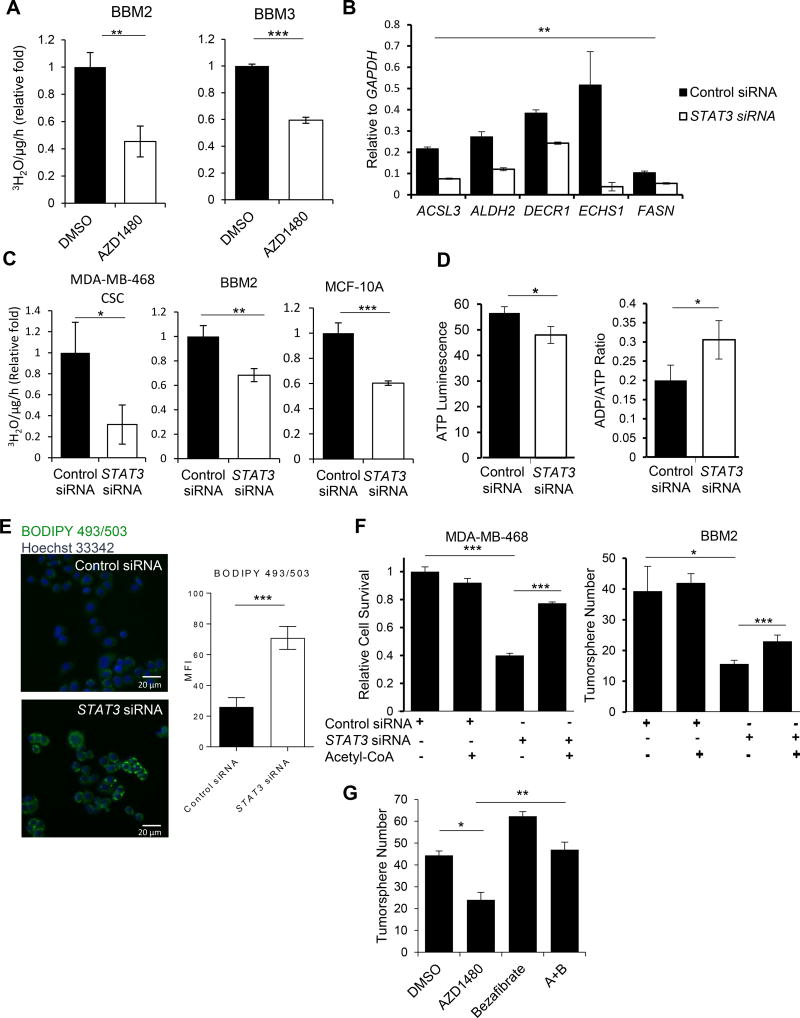
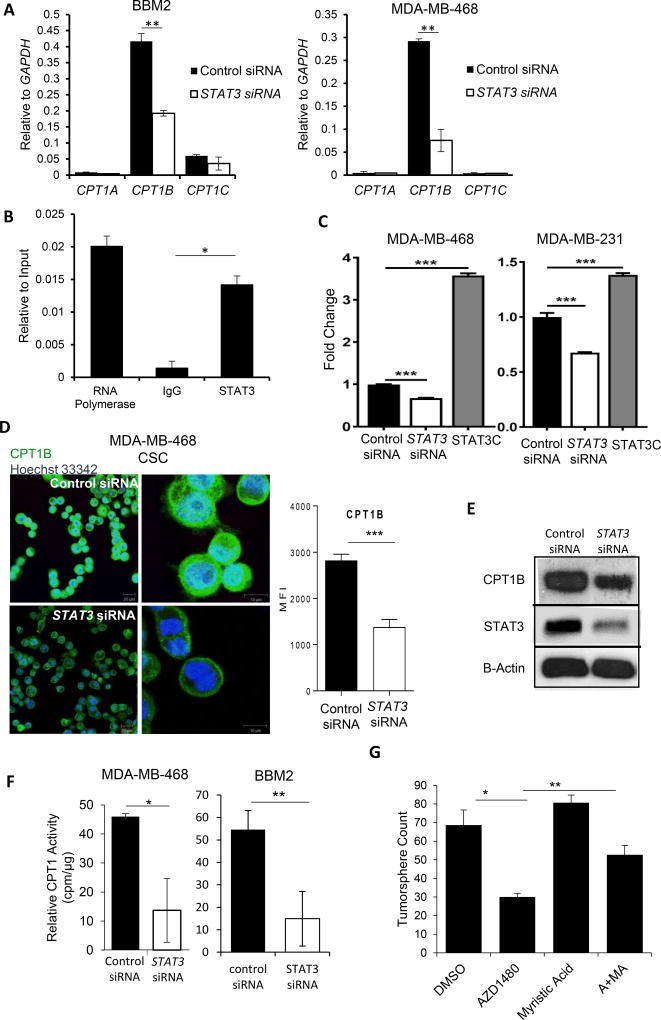
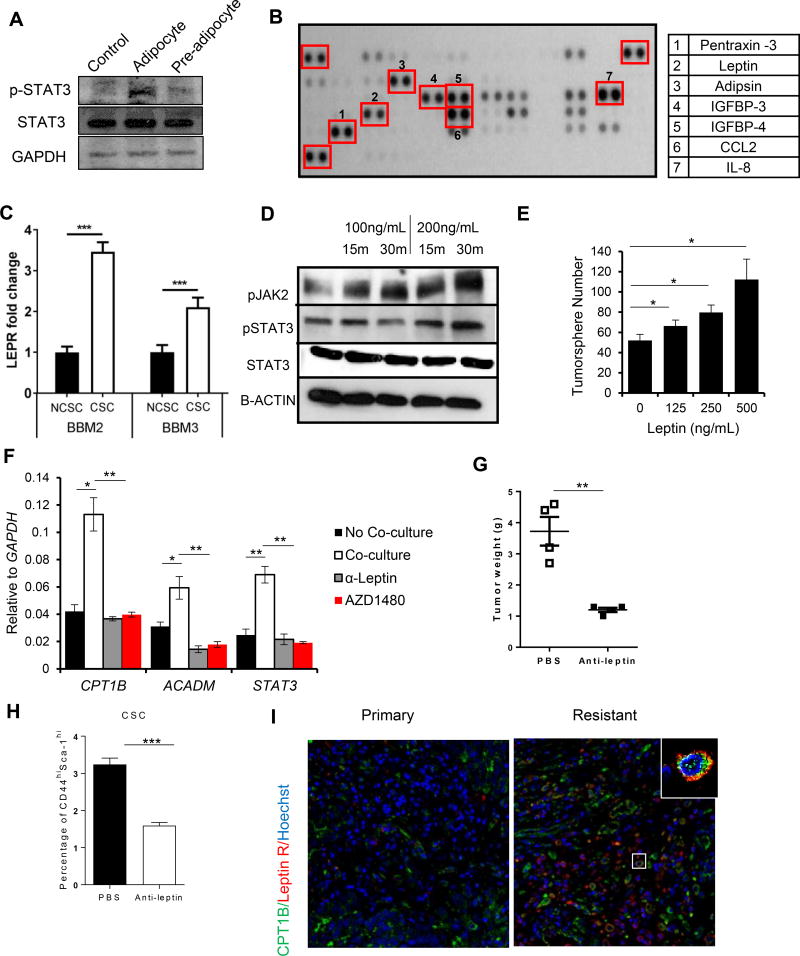
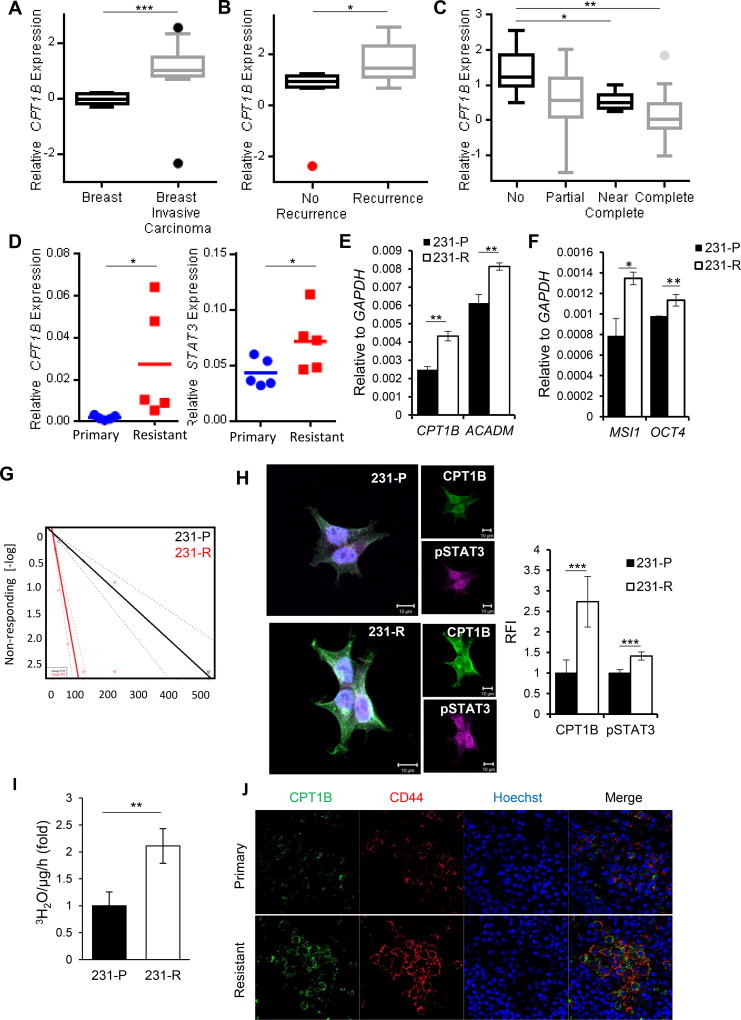
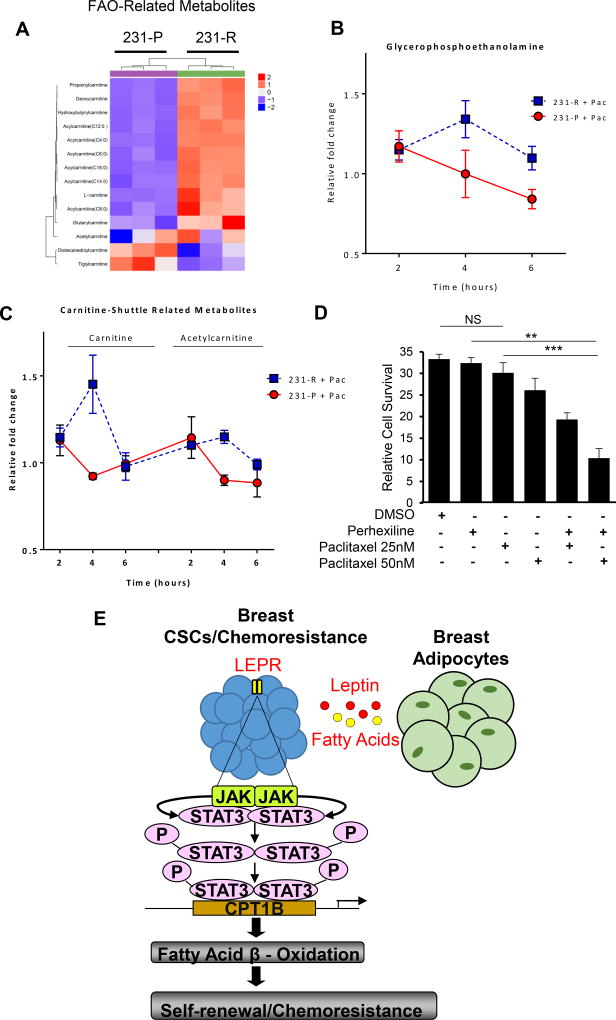
Cancer stem cells (CSCs) are critical for cancer progression and chemoresistance. How lipid metabolism regulates CSCs and chemoresistance remains elusive. Here, we demonstrate that JAK/STAT3 regulates lipid metabolism, which promotes breast CSCs (BCSCs) and cancer chemoresistance. Inhibiting JAK/STAT3 blocks BCSC self-renewal and expression of diverse lipid metabolic genes, including carnitine palmitoyltransferase 1B (CPT1B), which encodes the critical enzyme for fatty acid β-oxidation (FAO). Moreover, mammary-adipocyte-derived leptin upregulates STAT3-induced CPT1B expression and FAO activity in BCSCs. Human breast-cancer-derived data suggest that the STAT3-CPT1B-FAO pathway promotes cancer cell stemness and chemoresistance. Blocking FAO and/or leptin re-sensitizes them to chemotherapy and inhibits BCSCs in mouse breast tumors in vivo. We identify a critical pathway for BCSC maintenance and breast cancer chemoresistance.

Keywords: JAK/STAT3; breast cancer stem cell; chemoresistance; fatty acid β-oxidation; leptin.


Figures

Figure 1
Figure 1. Inhibiting JAK BCSCs Reduces Self-Renewal and Expression of Lipid Metabolic Genes
(A) Effects of AZD1480 on proliferation/survival of non-cancer stem cells (NCSC; CD24+) and cancer stem cells (CSC; CD44+/CD24−) of HCC1937 cells as shown by the ratio of trypan blue negative cells (live cells) treated with AZD1480 at the indicated concentrations or DMSO (0). Shown are mean ± SD (n=3). (B) Tumorsphere-forming assay comparing impacts of AZD1480 and DMSO treatments on tumorsphere formation of MCF7 cells. Shown are mean ± SD (n=3). (C) Real–time PCR analysis assessing expression of key lipid metabolic genes in MCF7 tumorspheres treated with DMSO or 1µM AZD1480. Shown are mean ± SD (n=3). (D) Fold-change in fatty acylcarnitines and L-carnitine in Hs578T, MDA-MB-436 and HCC1500 relative to BT20. Significance was determined by One-Way ANOVA with Tukey HSD Post Hoc Test. *p<0.05, **p<0.005, and ***p<0.0005
Figure 2
Figure 2. FAO is Elevated in BCSCS and Required for Self-Renewal
(A) FAO assay comparing of FAO levels in BBM2 tumorspheres (CSC) vs. adherent BBM2 cells (NCSC) and CD44+/CD24− (CSC) vs. CD24+ (NCSC) MDA-MB-468 cells. Shown are mean ± SD (n=3). (B) Immunofluorescent images of patient breast cancer tissues showing CD44+ cells with CPT1B elevated expression. (C) ATP luminescence assay showing differential ATP production in etomoxir-treated CSC MDA-MB-468, BBM2 and BBM3 tumorspheres compared to NCSC MDA-MB-468, BBM2 and BBM3 adherent cells. Shown are mean ± SD (n=3). (D) Cell proliferation of CSC and NCSC MDA-MB-468 cells after etomoxir treatments at the indicated concentrations. Shown are mean ± SD (n=3). (E) Limiting dilution assay demonstrating etomoxir impact on tumorsphere formation of BBM2 tumor cells (1 in 5.14 to 1 in 20.2 cells, p=9.26×10⁻⁹ with Χ2, n=18). (F) Flow cytometric analysis of the proportion of CD44high/Sca-1high cells in tumors harvested from MMTV-PyMT mice treated with PBS or 5mg/kg perhexiline. Shown are mean ± SD (n=4). (G) Real time PCR showing gene expression of SOX2 and ALDH1A1 in tumors harvested from MMTV-PyMT treated with PBS or 5 mg/kg perhexiline. Shown are mean ± SD (n=4).*p<0.05, **p<0.005, and ***p<0.0005
Figure 3
Figure 3. Inhibiting JAK/STAT3 Attenuates FAO and Decreases BCSC Self-Renewal
(A) FAO assay comparing levels of FAO in DMSO and 1µM AZD1480-treated BBM2 and BBM3 tumorspheres. Shown are mean ± SD (n=3). (B) Real-time PCR showing the effects of STAT3 siRNA on lipid metabolic genes in BBM2 tumorspheres. Shown are mean ± SD (n=3). (C) Comparison of FAO rates in CSC MDA-MB-468, BBM2 tumorspheres, and MCF-10A cells treated with control siRNA vs. STAT3 siRNA. Shown are mean ± SD (n=3). (D) Relative ATP and ADP/ATP ratio in MCF-10A cells after control or STAT3 siRNA treatment. Shown are mean ± SD (n=4). (E) BODIPY 493/503 staining showing effect of STAT3 siRNA on lipid droplets in CSC MDA-MB-468 cells. The fluorescence intensity was quantified and shown on the right side. (F) Cell survival assay of CSC MDA-MB-468 cells or tumorsphere formation of BBM2 tumor cells after indicated treatments. Shown are mean ± SD (n=4). (G) Tumorsphere formation of BBM2 after indicated treatments of 1µM AZD1480 or/and 5µM Bezafibrate. Shown are mean ± SD (n=3).*p<0.05, **p<0.005, and ***p<0.0005
Figure 4
Figure 4. STAT3 Modulates FAO through Transcriptional Regulation of CPT1B
(A) Real time PCR measuring CPT1A, CPT1B, and CPT1C mRNA levels in BBM2 tumorspheres and CSC MDA-MB-468 cells transfected with control or STAT3 siRNA. Shown are mean ± SD (n=3). (B) ChIP assay showing STAT3 binding to the CPT1B promoter in BBM2 tumorspheres. The results were normalized to input DNA. Shown are mean ± SD (n=3). (C) CPT1B promoterluciferase assay was measured in MDA-MB-468 and −231 breast cancer cells 24 hours after control or STAT3 siRNA transfection. Constitutively activated STAT3 (STAT3C) was used as a positive control. The luciferase activity was then normalized with control siRNA transfection. (D) Immunofluorescent images of CPT1B levels in CSC MDA-MB-468 cells transfected with control or STAT3 siRNA. White bar presents 10 µm. The fluorescence intensity was quantified and shown on the right side. (E) Western blotting measuring CPT1B and STAT3 protein levels in BBM2 tumorspheres transfected with control siRNA or STAT3 siRNA. β-actin was detected as a loading control. (F) Measurement of relative radioactivity (per µg protein) showing effects of STAT3 siRNA on CPT1 enzyme activity in CSC MDA-MB-468 cells and BBM2 tumorspheres. Shown are mean ± SD (n=3). (G) Tumorsphere formation of BBM2 tumorspheres treated with 1 uM AZD1480 or 5 µM myristic acid (MA). Shown are mean ± SD (n=3).*p<0.05, **p<0.005, and ***p<0.0005
Figure 5
Figure 5. Adipocyte-Derived Leptin Activates STAT3-CPT1B to Drive FAO in BCSCs
(A) Western blot showing increased phosphorylation of STAT3 at Y705 (pSTAT3) in BBM2 tumorspheres after co-culture with human breast adipocytes or pre-adipocyte. BBM2 culture alone was used as control. (B) Adipokine array identifying adipokines in supernatant from human breast adipocytes. Right, table listing the most highly secreted adipokines. (C) Real-time PCR measuring LEPR mRNA levels in BBM2 and BBM3 tumorspheres (CSC) vs. adherent cells (NCSC). LEPR expression of CSC was then normalized with NCSC. Shown are mean ± SD (n=3). (D) Western blot showing increases in phosphorylation of JAK2 (pJAK2) and STAT3 (pSTAT3) in BBM2 tumorspheres upon leptin stimulation with the indicated conditions. (E) Tumorsphere formation of BBM2 cells treated with leptin at the indicated concentrations. Shown are mean ± SD (n=3). (F) Real-time PCR comparing expression of CPT1B and ACADM in BBM2 tumorspheres cultured with or without human breast adipocytes, treated with leptin neutralizing antibody (α-Leptin) or 1µM AZD1480. Shown are mean ± SD (n=3). (G) Tumor weights of tumors collected from multiple sites in MMTV-PyMT mice treated with PBS or α-Leptin (250 µg/kg). Shown are mean ± SD (n=4). (H) Flow cytometric analyses of single-cell suspensions prepared from tumors collected from MMTV-PyMT mice treated with PBS or α-Leptin (250 µg/kg). Shown are mean ± SD (n=4). (I) Expression of Leptin receptor and CPT1B in primary and resistant TNBC tumors. FFPE tissue sections from TNBC patients were stained by immunofluorescence for Leptin receptor (red) and CPT1B (green); nuclei were counterstained with Hoechst (blue).*p<0.05, **p<0.005, and ***p<0.0005.
Figure 6
Figure 6. STAT3-CPT1B Mediated FAO Pathway Promotes Chemoresistance
(A, B) Oncomine analyses of the Finak§ breast cancer data set comparing relative CPT1B mRNA expression in normal breast tissues and breast carcinoma tissues and tumors from patients with recurrence and no recurrence within 5 years. (C) Oncomine analysis of Gluck§ breast cancer dataset of CPT1B mRNA expression in breast tumors from patients with no, partial, near complete, and complete response to paclitaxeltaxol chemotherapy. (D) Real time PCR to assess CPT1B and STAT3 gene expression in ex vivo cultured breast cancer biopsies collected before (primary) and after chemotherapy (resistant). (E) Real time PCR measuring CPT1B and ACADM gene expression in 231-P (parental) and 231-R (resistant) cells. Shown are mean ± SD (n=3). The results were normalized with GAPDH expression. (F) Real time PCR comparing gene expression of MSI1 and OCT4 in 231-P and 231-R cells. Shown are mean ± SD (n=3). The results were normalized with GAPDH expression. (G) Limiting dilution assay comparing tumorsphere forming ability of 231-P and 231-R cells (1 in 13.56 to 1 in 2.24 cells, p=1.26×10⁻¹⁶ with Χ2, n=18). (H) Immunofluorescent images comparing protein levels of CPT1B and pSTAT3 in 231-P and 231-R cells. Right, quantification of relative fluorescence intensities of CPT1B and STAT3. Shown are mean ± SD (n≥5). (I) Comparison of FAO rates between 231-P and -R cells. Shown are mean ± SD (n=3). (J) Expression of CD44 and CPT1B in primary and resistant TNBC tumors. FFPE tissue sections from TNBC patients were stained by immunofluorescence for CD44 (red) and CPT1B (green); nuclei were counterstained with Hoechst (blue). §Databases are named after the first author of originally published data. *p<0.05, **p<0.005, and ***p<0.0005.
Figure 7
Figure 7. Metabolomic Analyses Reveal an FAO Signature in Drug-Resistant Tumor Cells
(A) Heatmap depicting abundances of detected FAO- and carnitine-shuttle pathway-related metabolites in chemoresistant 231-R and parental 231-P TNBC cell lines. Values were autoscaled; clustering was conducted using Euclidean Distance and Ward’s method. Fold-change in glycerophosphoethanolamine abundance (B) and carnitine/acetylcarnitine levels (C) following 2, 4 or 6 hours of paclitaxel challenge in 231-R and -P TNBC cell lines relative to respective time-matched vehicle (DMSO) controls. P-value represents differences in the area under the curve between 231-R and -P cells. * p<0.05. (D) Cell survival assay showing perhexilline sensitizes 231-R cells to paclitaxel. Shown are mean ± SD (n=4). (E) Schematic of how JAK/STAT3 activates FAO in BCSCs through intrinsic and extrinsic pathways.

Comment in

References

    1. Abumrad NA, Elmaghrabi MR, Amri EZ, Lopez E, Grimaldi PA. Cloning of a Rat Adipocyte Membrane-Protein Implicated in Binding or Transport of Long-Chain Fatty-Acids That Is Induced during Preadipocyte Differentiation - Homology with Human Cd36. Journal of Biological Chemistry. 1993;268:17665–17668. - PubMed
    1. Al-Hajj M, Wicha MS, Benito-Hernandez A, Morrison SJ, Clarke MF. Prospective identification of tumorigenic breast cancer cells. Proceedings of the National Academy of Sciences of the United States of America. 2003;100:3983–3988. - PMC - PubMed
    1. Baumann J, Sevinsky C, Conklin DS. Lipid biology of breast cancer. Biochimica et biophysica acta. 2013;1831:1509–1517. - PMC - PubMed
    1. Bose D, Zimmerman LJ, Pierobon M, Petricoin E, Tozzi F, Parikh A, Fan F, Dallas N, Xia L, Gaur P, et al. Chemoresistant colorectal cancer cells and cancer stem cells mediate growth and survival of bystander cells. British journal of cancer. 2011;105:1759–1767. - PMC - PubMed
    1. Bozza PT, Viola JP. Lipid droplets in inflammation and cancer. Prostaglandins, leukotrienes, and essential fatty acids. 2010;82:243–250. - PubMed

Publication types

MeSH terms