. 2018 Jan 8;33(1):75-90.e7.
doi: 10.1016/j.ccell.2017.11.007. Epub 2017 Dec 14.

β2 Adrenergic-Neurotrophin Feedforward Loop Promotes Pancreatic Cancer

Affiliations

β2 Adrenergic-Neurotrophin Feedforward Loop Promotes Pancreatic Cancer

Bernhard W Renz et al. Cancer Cell. .

Erratum in

  • β2 Adrenergic-Neurotrophin Feedforward Loop Promotes Pancreatic Cancer.
    Renz BW, Takahashi R, Tanaka T, Macchini M, Hayakawa Y, Dantes Z, Maurer HC, Chen X, Jiang Z, Westphalen CB, Ilmer M, Valenti G, Mohanta SK, Habenicht AJR, Middelhoff M, Chu T, Nagar K, Tailor Y, Casadei R, Di Marco M, Kleespies A, Friedman RA, Remotti H, Reichert M, Worthley DL, Neumann J, Werner J, Iuga AC, Olive KP, Wang TC. Renz BW, et al. Cancer Cell. 2018 Nov 12;34(5):863-867. doi: 10.1016/j.ccell.2018.10.010. Cancer Cell. 2018. PMID: 30423300 Free PMC article. No abstract available.

Abstract

Catecholamines stimulate epithelial proliferation, but the role of sympathetic nerve signaling in pancreatic ductal adenocarcinoma (PDAC) is poorly understood. Catecholamines promoted ADRB2-dependent PDAC development, nerve growth factor (NGF) secretion, and pancreatic nerve density. Pancreatic Ngf overexpression accelerated tumor development in LSL-Kras+/G12D;Pdx1-Cre (KC) mice. ADRB2 blockade together with gemcitabine reduced NGF expression and nerve density, and increased survival of LSL-Kras+/G12D;LSL-Trp53+/R172H;Pdx1-Cre (KPC) mice. Therapy with a Trk inhibitor together with gemcitabine also increased survival of KPC mice. Analysis of PDAC patient cohorts revealed a correlation between brain-derived neurotrophic factor (BDNF) expression, nerve density, and increased survival of patients on nonselective β-blockers. These findings suggest that catecholamines drive a feedforward loop, whereby upregulation of neurotrophins increases sympathetic innervation and local norepinephrine accumulation.

Keywords: NGF-BDNF; TRK; adrenergic signaling; neurotrophins; pancreatic cancer; stress; β-blockers.


Figures

Figure 1
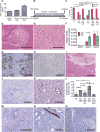
Figure 1. Chronic Neuropsychological Stress Promotes Kras Induced Pancreatic Carcinogenesis
(A) Systemic epinephrine levels in KC mice measured by ELISA before, 60 min in stress and 60 min after stress. (B) Experimental set up: mice were stressed starting at 6 weeks of age for 6 hr/day, 5 days/week until 20 weeks of age. (C) Incidence of PDAC at 20 weeks of age in control KC mice (KC) (n=12), stressed KC mice (KC CRS) (n=13), stressed KC mice treated with ICI 118,551 (ICI) before stress was applied (KC CRS ICI) (n=12), KC mice treated with isoproterenol (ISO) continuously from 6-7 weeks to 20 weeks (KC ISO) (n=12), stressed KC-Adrb2 KO mice (KC CRS Adrb2 KO) (n=8), and stressed KC mice after bilateral adrenalectomy at 6-7 weeks of age (KC CRS ADx) (n=12). (D, E) Representative images of pancreatic H&E slides from KC (D) and KC CRS mice (E) at 20 weeks. (F) Relative quantification of Adrb1, Adrb2, and Adrb3 mRNA expression in pancreata from WT mice and KC mice (n=3, respectively). (G, H) Representative images of immunohistochemistry (IHC) for ADRB2 in pancreata from KC (G) and WT mice (H). (I) Representative image of a pancreatic H&E slide from KC CRS ICI mice at 20 weeks. (J, K) Representative images of IHC for peripherin in pancreata from KC (J) and KC CRS mice (K). (L) Quantification of the peripherin+ area in pancreata from KC (n=12), KC CRS (n=13), KC CRS ICI (n=12), KC ISO (n=12), and KC CRS ADx (n=12) at 20 weeks. (M-O) Representative images of IHC for peripherin in pancreata from KC CRS ICI (M), KC ISO (N), and KC CRS ADx mice (O). Scale bars, 200 μm. Means ± SEM. *p<0.05; **p<0.001; ***p<0.0001. See also Figure S1.
Figure 2
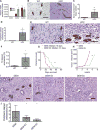
Figure 2. ADRB2 Blockade Significantly Increases Overall Survival in KPC Mice
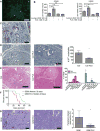
(A) Relative quantification of Adrb1, Adrb2, and Adrb3 mRNA expression in pancreata from WT mice and PDAC from KPC mice. **p<0.001. (B) Representative photographs of peripherin IHC in the pancreas of WT mice and PDAC of KPC mice. Black arrows indicate small nerves in normal pancreatic tissue. (C, D) Bar graphs showing quantification of peripherin staining in pancreata from WT and PDAC from KPC mice (n=15 each group) as neural density (nerve number/mm2 tissue section) (**p=0.0093) (C) and positively stained neuronal area (peripherin stained area/section [%]) (**p=0.0087) (D). (E) Representative photographs of tyrosine hydroxylase (TH) IHC in the pancreas from WT mice and PDAC from KPC mice. Black arrows indicate small TH+ nerves in normal pancreatic tissue. (F) Bar graph showing quantification of TH+ staining in pancreata from WT mice and PDAC from KPC mice (TH stained area/section [%]). *p=0.0061. (G) Kaplan-Meier curves of KPC mice treated with gemcitabine (GEM; n=16) and KPC mice treated with gemcitabine and ICI 118,551 (GEM ICI; n=16) enrolled with tumors of 20-60 mm3. **p=0.0038. This experiment and Figure S2H were conducted at the same time and have the same control group. (H) Tumor volume curves of KPC mice treated as shown in (G). (GEM; n=16, GEM ICI n=16). **p=0.0026. (I) Representative images of peripherin IHC in PDAC from KPC mice treated with gemcitabine (GEM), gemcitabine and ICI 118,551 (GEM ICI), and gemcitabine and ganglionectomy (GEM Gx). (J) Bar graph showing quantification of the area stained positive for peripherin in PDAC from KPC mice treated with GEM, GEM ICI, and GEM Gx. *p<0.05. Means ± SEM. Scale Bars, 200 μm. See also Figure S2.
Figure 3
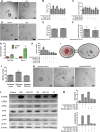
Figure 3. Catecholamines Promote Acinar to Ductal Metaplasia and Drive Proliferation
(A) Representative photographs of 3D pancreatic spheres isolated from LSL-Kras+/G12D mice treated with an Adeno-Cre virus alone (control) or together with ISO (ISO). (B, C) Quantification of number (B) and size (C) of LSL-Kras+/G12D pancreatic spheres treated with an Adeno-Cre virus and the substance indicated after 7 days in culture. (D) Representative photographs of 3D pancreatic spheres from LSL-Kras+/G12D;Adrb2 KO mice treated with an Adeno-Cre virus alone (control) or together with ISO (ISO). (E, F) Quantification of number (G) and size (H) of LSL-Kras+/G12D;Adrb2 KO pancreatic spheres treated with an Adeno-Cre virus and ISO after 7 days in culture. (G) Fold increase in mRNA expression of Oct3/4 and Sox9 in LSL-Kras+/G12D pancreatic spheres treated with an Adeno-Cre virus alone (control) or together with ISO (ISO). (H) Quantification of number of LSL-Kras+/G12D pancreatic spheres treated with an Adeno-Cre virus and ISO, KT5720 and U0126; after 7 days in culture. (I) Experimental set up of co-culture studies using pancreatic spheres from LSL-Kras+/G12D;Pdx1-Cre mice (KC) (right) and DRGs (red) from E14.5 old mTmG murine embryos in a separate Matrigel dot (left), spheres and DRG dots are connected via a Matrigel bridge. (J) Quantification of number of pancreatic spheres isolated from KC mice and placed next to a Matrigel dot (spheres/control), a Matrigel dot containing a DRG from an E14.5 old mTmG murine embryo (spheres/DRG) and a Matrigel dot containing a DRG from an E14.5 old mTmG murine embryo and treated with ICI (spheres/DRG/ICI). (K) Representative photographs of 3D pancreatic spheres, cocultured as described in (J). (L) Western Blot analyzing signaling pathways after ISO or norepinephrine (NE) and/or ICI treatment in Panc-1 cells. (M) Quantification of densitometry of Western Blot depicted in (L) for phosphorylated ERK (pERK)/ERK and phosphorylated CREB (pCREB)/CREB. Means ± SEM. *p<0.05. Scale Bars, 100 μm. See also Figure S3.
Figure 4
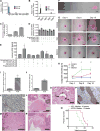
Figure 4. Adrenergic Signaling Increases Neurotrophin Secretion and Promotes PDAC Development through Tumor-Associated Axonogenesis
(A) Relative quantification of mRNA expression of neurotrophins and axonal guidance proteins in KPC tumors sorted for EpCAM+ and EpCAM cells (n=6). (B) Relative quantification of mRNA expression of NTs in pancreata from WT, KC mice and PDAC from KPC mice (n=5 per group). (C) Relative quantification of mRNA expression of Ngf in K8282 cells after stimulation with increasing concentrations of NE. (D) Relative quantification of mRNA expression of Ngf in K8282 cells after stimulation with NE and pretreatment with ICI, KT5720 and U0126. (E) Murine β-NGF levels measured by ELISA in the supernatant of K8282 cells after stimulation with NE and pretreatment with ICI, atenolol, and propranolol. (F) Experimental set up of co-culture studies using K8282 cells (left side) and DRGs from E14.5 old mTmG murine embryo (red, right side). Scale bar, 200 μm. (G) Representative confocal pictures of DRGs from E14.5 mTmG murine embyos cultured next to K8282 cells as depicted in (F), control, treated with ISO (ISO), and pretreated with ICI before ISO treatment (ISO/ICI) after 4, 6 and 10 days in co-culture, respectively. Scale bars, 200 μm. (H) Quantification of axonogenesis from DRGs in co-culture with K8282, without treatment (control), treated with ISO, and pretreated with ICI before ISO treatment (ISO/ICI) at 4, 6 and 10 days in co-culture. (I) Quantification of the peripherin+ stained area (IHC) in pancreata from KC and KCN mice (n=5) at 20 weeks. (J) Quantification of the TH+ stained area (IHC) in pancreata from KC and KCN mice (n=5). (K) Representative image of pancreatic peripherin IHC in 20-week-old KCN mice. Scale bar, 200 μm. (L-N) Representative images of pancreatic sections (H&E) from KCN mice at 20 weeks showing an enlarged intrapancreatic ganglion (L), foci of micronodular small duct (M) and large duct (N) intraepithelial neoplasia (PanIN-3). Scale bars, 100 μm in (M), 200 μm in (L) and (N). (O) Representative image of H&E staining showing perineural invasion (arrows) in a pancreatic section from a KPCN mouse. Black star indicates a intratumoral nerve. Cross indicates tumor cells. Scale bar, 50 μm. (P) Representative image of pancreatic peripherin IHC in KPCN mice. Scale bar, 200 μm. (Q) Kaplan-Meier curves showing OS of KPC (n=12) and KPCN (n=6) mice. Means ± SEM. *p<0.05, **p<0.005. See also Figure S4.
Figure 5
Figure 5. Blockade of NGF/Trk Pathway Inhibits Proliferation and Innervation and Increases Overall Survival in KPC Mice
(A) Representative image of pan-Trk immunocytochemistry (ICC) of K8282 cells. (B) MTT-assay of murine PDAC cells K2548 and K8282 treated with murine β-NGF with and without pretreatment of PLX-7486. (C) Representative image of pancreatic pan-Trk IHC of cerulein-injected KC mice at 20 weeks. (D) Representative image of pancreatic Ki67 IHC of cerulein-injected KC mice at 20 weeks on control diet (Cer) and PLX-7486 containing diet (Cer PLX); Quantification of Ki67 staining of pancreata depicted (n=10 mice per group) (right). (E) Representative image of pancreatic H&E staining of cerulein-injected KC mice at 20 weeks on control diet (Cer) and PLX-7486 containing diet (Cer PLX); Pathological scoring of PanINs of pancreata depicted (n=10 mice each group). (F) Kaplan-Meier curves of KPC mice enrolled with tumor diameters of 3-6 mm and treated by GEM biweekly on control diet (GEM) (n=13) or by GEM biweekly on PLX-7486 containing diet (GEM PLX) (n=10). (G) Representative images of peripherin IHC in PDAC from KPC mice treated with GEM (GEM) and KPC mice treated with GEM and PLX-7486 (GEM PLX); Bar graph showing quantification of peripherin staining of pancreata depicted (GEM n=10 and GEM PLX n=13 mice). Means ± SEM. *p<0.05, **p<0.005; ***p<0.001. Scale bars, 200 μm. See also Figure S5.
Figure 6
Figure 6. Nonselective β-Blocker Treatment Increases Overall Survival in Surgically Resected PDAC Patients
(A) Representative photographs of organoids generated from primary resected human PDAC specimen, control, GEM treated, propranolol (Propranolol) treated and propranolol and GEM treated (GEM/Propranolol) cultures. (B) Bar graph shows quantification of relative light units (RLU) of treated human PDAC organoid cultures (**p=0.0071; ***p<0.0001; ****p=0.0002). (C) Kaplan-Meier curves of PDAC patients (n=631) comparing patients without β-blocker medication (grey line) (n=427) and any β-blocker (green line) (n=168) after surgical resection of the primary tumor. (D) Kaplan-Meier curves of PDAC patients (n=631) comparing patients without β-blocker medication (grey line) (n=427), β1-selective agents (blue line) (n=151) and nonselective β-blockers (red line) (n=17) after surgical resection of the primary tumor, *p=0.031. (E) Representative images of IHC for protein S-100 from PDAC sections from patients having no β-blocker (NBB, n=8), β1-selective agents (SB1B, n=8) and a nonselective β-blocker (NSBB, n=5) (3 sections/patient; Bar graph shows average number of intratumoral nerves/10 high power fields (HPF) (3 sections/patient, *p=0.0338). (F) Representative images of IHC for BDNF from tumor sections from NBB (n=8), SB1B (n=8) and NSBB patients (n=5) (3 sections/patient); Bar Graph showing average scoring of BDNF IHC (3 sections/patient, ***p<0.0001) (right). Means ± SEM. Scale Bars, 50 μm in (A), 100 μm (E) and (F). See also Figure S6.

Comment in

References

    1. Anders S, Pyl PT, Huber W. HTSeq—a Python framework to work with high-throughput sequencing data. Bioinformatics. 2015;31(2):166–169. - PMC - PubMed
    1. Apte MV, Wilson JS. Dangerous liaisons: pancreatic stellate cells and pancreatic cancer cells. J Gastroenterol Hepatol. 2012;27(Suppl 2):69–74. - PubMed
    1. Bapat AA, Munoz RM, Von Hoff DD, Han H. Blocking Nerve Growth Factor Signaling Reduces the Neural Invasion Potential of Pancreatic Cancer Cells. PLoS ONE. 2016;11:e0165586. - PMC - PubMed
    1. Barron TI, Connolly RM, Sharp L, Bennett K, Visvanathan K. Beta blockers and breast cancer mortality: a population-based study. Journal of Clinical Oncology. 2011;29:2635–2644. - PubMed
    1. Batty GD, Russ TC, Stamatakis E, Kivimäki M. Psychological distress in relation to site specific cancer mortality: pooling of unpublished data from 16 prospective cohort studies. Bmj. 2017;356:j108–j111. - PMC - PubMed

Publication types

MeSH terms