. 2017 Nov 22:11:373.
doi: 10.3389/fncel.2017.00373. eCollection 2017.

Propofol Exposure in Early Life Induced Developmental Impairments in the Mouse Cerebellum

Affiliations

Propofol Exposure in Early Life Induced Developmental Impairments in the Mouse Cerebellum

Rui Xiao et al. Front Cell Neurosci. .

Abstract

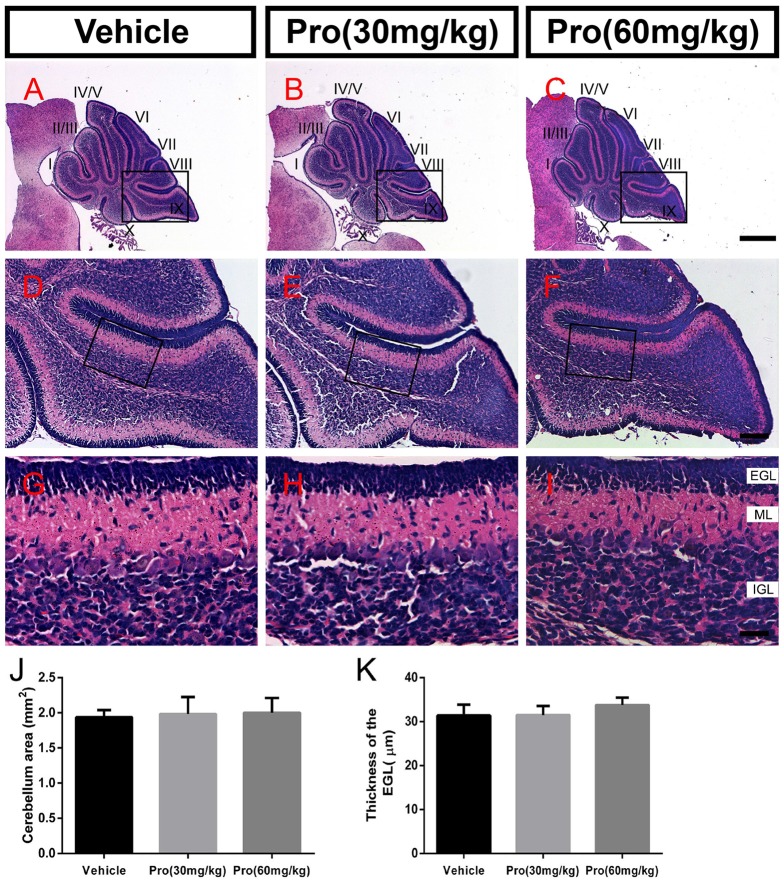
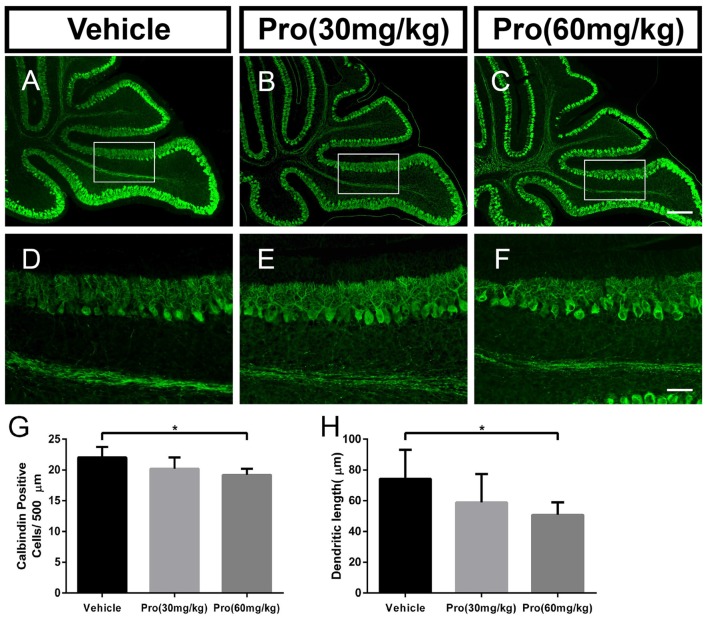
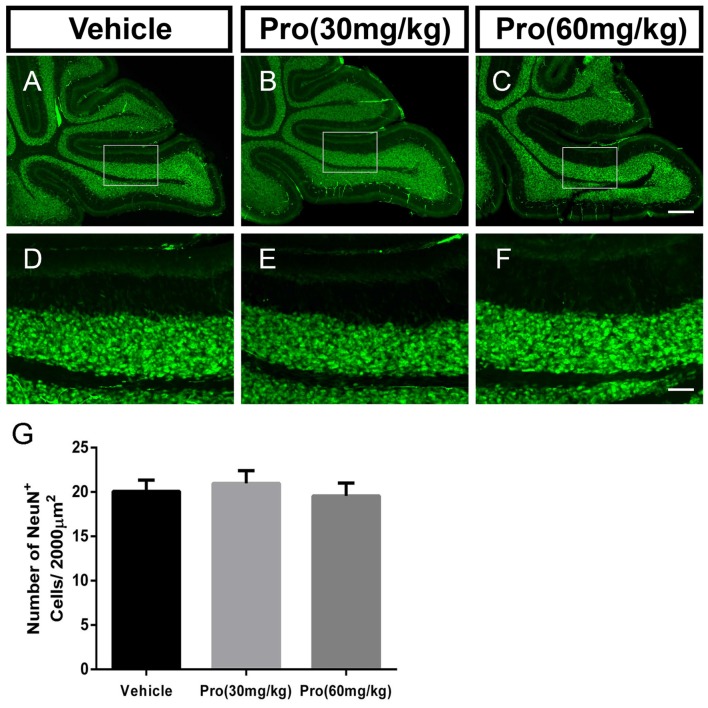
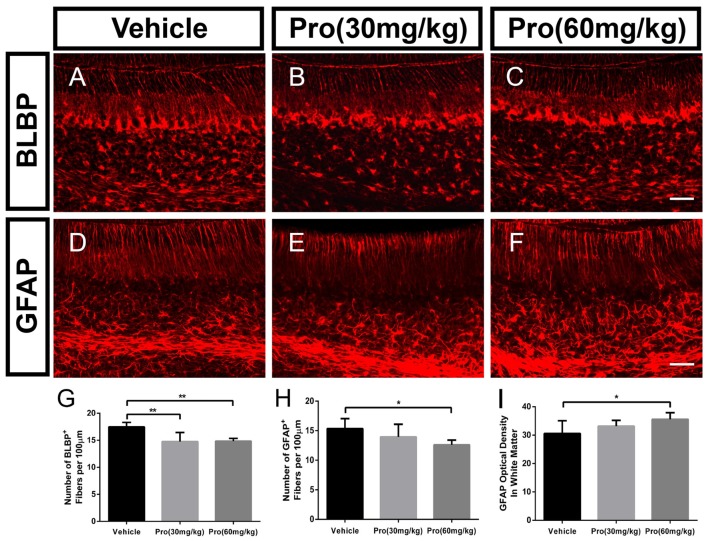
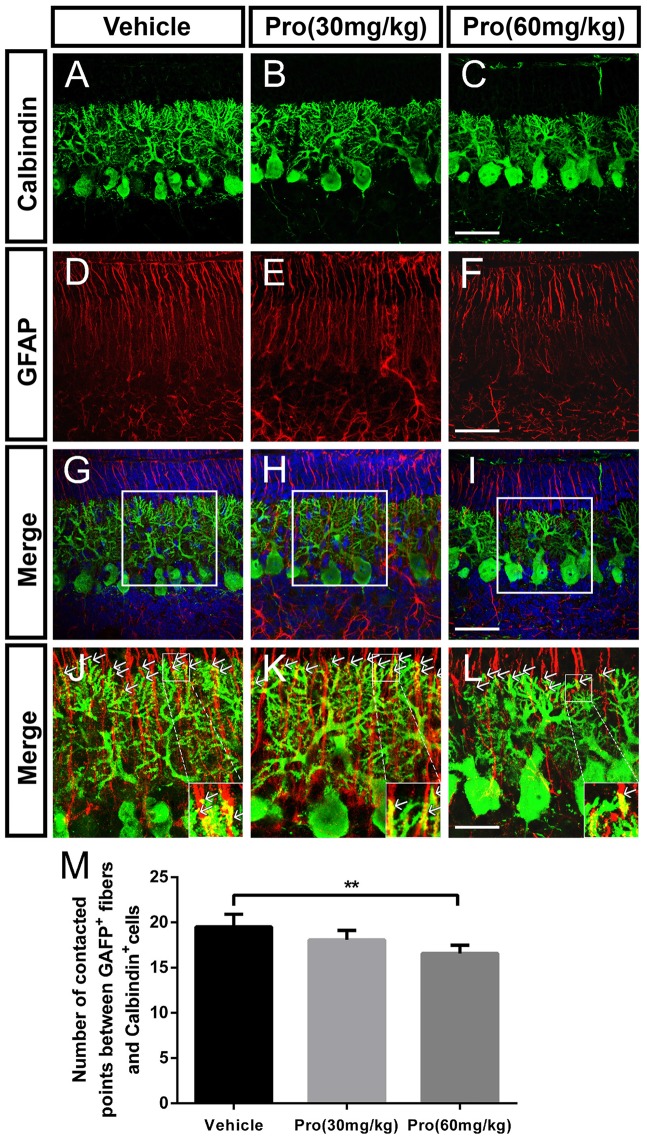
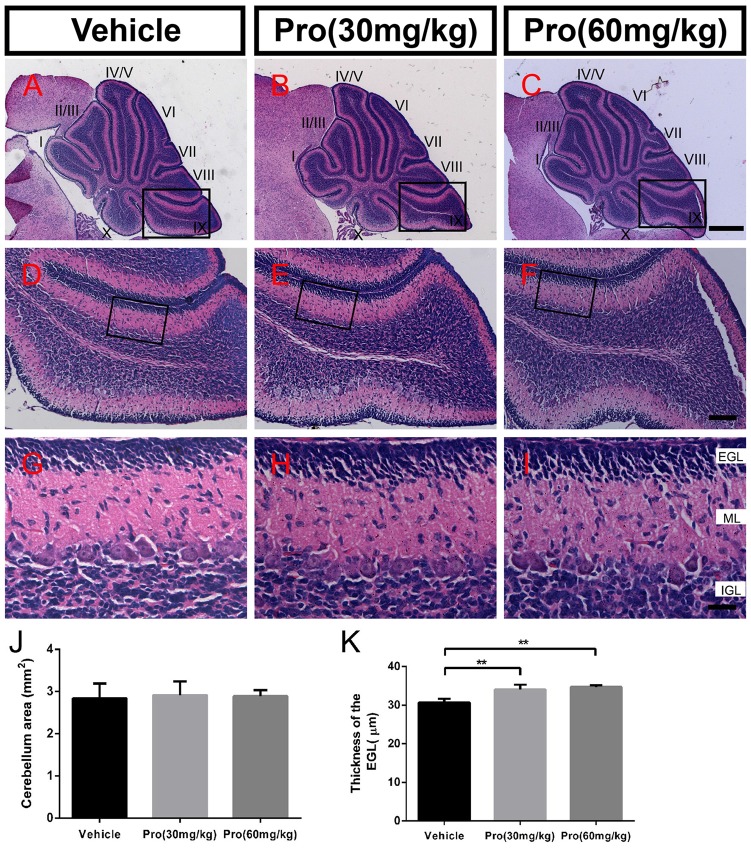
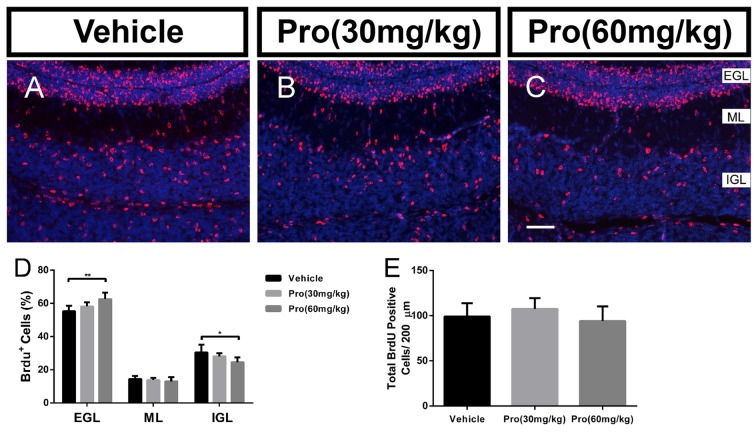
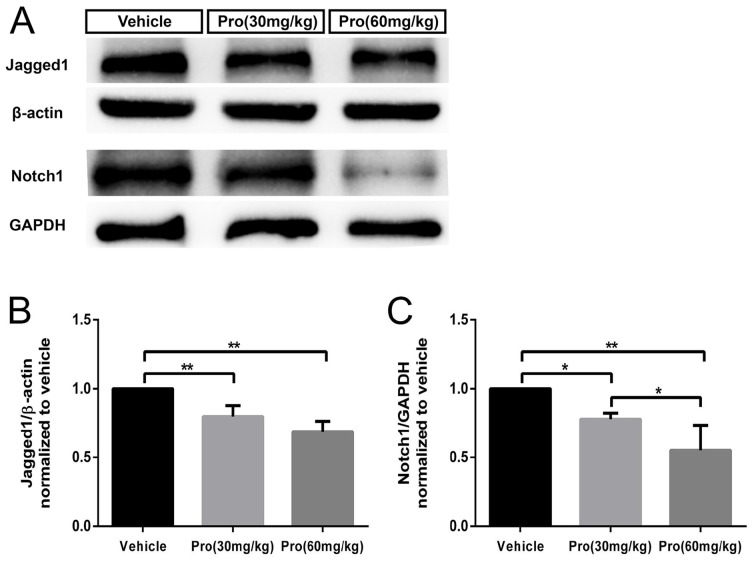
Propofol is a widely used anesthetic in the clinic while several studies have demonstrated that propofol exposure may cause neurotoxicity in the developing brain. However, the effects of early propofol exposure on cerebellar development are not well understood. Propofol (30 or 60 mg/kg) was administered to mice on postnatal day (P)7; Purkinje cell dendritogenesis and Bergmann glial cell development were evaluated on P8, and granule neuron migration was analyzed on P10. The results indicated that exposure to propofol on P7 resulted in a significant reduction in calbindin-labeled Purkinje cells and their dendrite length. Furthermore, propofol induced impairments in Bergmann glia development, which might be involved in the delay of granule neuron migration from the external granular layer (EGL) to the internal granular layer (IGL) during P8 to P10 at the 60 mg/kg dosage, but not at the 30 mg/kg dosage. Several reports have suggested that the Notch signaling pathway plays instructive roles in the morphogenesis of Bergmann glia. Here, it was revealed that propofol treatment decreased Jagged1 and Notch1 protein levels in the cerebellum on P8. Taken together, exposure to propofol during the neonatal period impairs Bergmann glia development and may therefore lead to cerebellum development defects. Our results may aid in the understanding of the neurotoxic effects of propofol when administrated to infants.

Keywords: cerebellum; development; mouse; neurotoxicity; propofol.


Figures

Figure 1
Figure 1
Propofol treatment did not alter the formation of the cerebellum at P8. (A–C) The folia structure of the cerebellum at P8 is revealed by Hematoxylin-eosin (HE) staining. (D–F) Magnifications of panels (A–C) show the structure of lobe IX. (G–I) Magnified of the area identified by the black boxes in panels (E–H) show the external granular layer (EGL), molecular layer (ML) and internal granule layer (IGL) of lobe lobe IX. (J) Propofol treatment did not alter the morphologies or cerebellar areas at P8 between the groups. (K) Comparison of relatively identical areas from lobe IX show no obvious differences in the thickness of the EGL at P8 between the groups. Data are presented as the mean ± SD (n = 4). Scale bar: (A–C): 500 μm; (D–F): 100 μm; and (G–I): 25 μm.
Figure 2
Figure 2
Propofol treatment decreased the number of Purkinje cells and depressed the dendrite length at P8. (A–C) Calbindin-stained cerebellar Purkinje cells from the (A) Vehicle, (B) Propofol (30 mg/kg) and (C) Propofol (60 mg/kg) groups. (D–F) Magnified images of Panels (A–C) show the calbindin-positive cells and their dendrites in lobe IX. (G) Quantification of the number of calbindin-positive cells in the purkinje cell layer (PCL). (H) Quantification of the primary Purkinje dendrite length. Data are presented as the mean ± SD (n = 5). Scale bar: (A–C): 200 μm and (D–F): 50 μm. *P < 0.05.
Figure 3
Figure 3
Propofol treatment did not affect the NeuN-positive cells in the IGL at P8. (A–C) NeuN-stained cerebellar granule neurons from the (A) Vehicle, (B) Propofol (30 mg/kg) and (C) Propofol (60 mg/kg) groups. (D–F) Magnified images of panels (A–C) show the NeuN-positive cells in lobe IX. (G) Quantification of the NeuN positive cells in the IGL. Data are presented as the mean ± SD (n = 5). Scale bar: (A–C): 200 μm and (D–F): 50 μm.
Figure 4
Figure 4
Propofol treatment suppressed Bergmann glial cell filiform processes at P8. (A–C) Brain lipid binding protein (BLBP)-stained Bergmann glia fibers in lobe IX from the (A) Vehicle, (B) Propofol (30 mg/kg) and (C) Propofol (60 mg/kg) groups. (D–F) Glial fibrillary acidic protein (GFAP)-stained Bergmann glia fibers in lobe IX from the (D) Vehicle, (E) Propofol (30 mg/kg) and (F) Propofol (60 mg/kg) groups. (G) Quantification of the number of BLBP-positive fibers in the ML. (H) Quantification of the number of GFAP-positive fibers in the ML. (I) Quantification of the optical density of GFAP-positive staining in the white matter. Data are presented as the mean ± SD (n = 5). Scale bar: (A–F): 50 μm. *P < 0.05 and **P < 0.01.
Figure 5
Figure 5
Propofol treatment disrupted the contacts between Purkinje cells and Bergmann glial cells at P8. (A–L) Immunolabeling for calbindin (green), GFAP (red), 4′,6-diamidino-2-phenylindole (DAPI) (blue), their merged images and respective high-resolution images of the merges in the cerebellar lobe IX. (A–C) Calbindin-stained Purkinje cells from the (A) Vehicle, (B) Propofol (30 mg/kg) and (C) Propofol (60 mg/kg) groups. (D–F) GFAP-stained Bergmann glial cell fibers from the (D) Vehicle, (E) Propofol (30 mg/kg) and (F) Propofol (60 mg/kg) groups. (G–I) The merged images showing the calbindin staining, GFAP staining and DAPI in the PCL. (J–L) Magnified images of panels (G–I) show the relationship between the calbindin-positive cells and GFAP-positive cells. The arrows indicate that the tips of calbindin-immunopositive dendrites are intimately attached to the rod-like shaft of Bergmann fiber contacting domains (M) Quantification of the numbers of contact points between the GFAP-positive fibers and calbindin-positive cells around the border between the ML and EGL in the identical lobe of the cerebellum. Data are presented as the mean ± SD (n = 5). Scale bar: (A–I): 50 μm and (J–L): 25 μm. **P < 0.01.
Figure 6
Figure 6
Propofol treatment increased the thickness of the EGL at P10. (A–C) The folia structure of the cerebellum is revealed by HE staining from the (A) Vehicle, (B) Propofol (30 mg/kg) and (C) Propofol (60 mg/kg) groups. (D–F) Magnified images of panels (A–C) show the structure of lobe IX. (G–I) Magnified areas identified by the black boxes in panels (D–F) show the EGL, ML and IGL, respectively, from lobe IX. (J) Propofol treatment did not alter the morphology or cerebellar area at P10 between the groups. (K) Comparison of relatively identical areas from lobe IX show that propofol treatment increases the thickness of the EGL at P10 compared with the vehicle-treated mice. Data are presented as the mean ± SD (n = 5). Scale bar: (A–C): 500 μm, (D–F): 100 μm, and (G–I): 25 μm. **P < 0.01.
Figure 7
Figure 7
Propofol treatment suppressed the radial migration of the granule neurons from the EGL to IGL. Granule neurons were labeled with BrdU in vivo at P8 and the cerebella were harvested at P10 (A–C). Sections were counterstained with DAPI (blue). (D) Quantification of the percentage of BrdU-positive cells in EGL, ML, or IGL to the total BrdU-positive cells at P10. (E) Quantification of the total number of BrdU-positive cells in EGL, ML and IGL at P10. Data are presented as the mean ± SD (n = 5). Scale bar: (A–C): 50 μm. *P < 0.05 and **P < 0.01.
Figure 8
Figure 8
Propofol treatment induced down-regulation of the Jagged1/Notch pathway in the cerebellum at P8. (A) Representative western blotting for the Jagged1 and Notch1 proteins from the cerebella in each group. (B) Densitometric quantification of Jagged1. Jagged1 protein levels in the Propofol (30 mg/kg)- and Propofol (60 mg/kg)-treated groups were significantly lower than in the vehicle-treated group. (C) Densitometric quantification of Notch. Notch1 protein levels in the Propofol (30 mg/kg)- and Propofol (60 mg/kg)-treated groups were significantly lower than in the vehicle-treated group. *P < 0.05 and **P < 0.01.

Similar articles

Cited by

References

    1. Altman J., Winfree A. T. (1977). Postnatal development of the cerebellar cortex in the rat. V. Spatial organization of purkinje cell perikarya. J. Comp. Neurol. 171, 1–16. 10.1002/cne.901710102 - DOI - PubMed
    1. Ango F., Wu C., Van der Want J. J., Wu P., Schachner M., Huang Z. J. (2008). Bergmann glia and the recognition molecule CHL1 organize GABAergic axons and direct innervation of Purkinje cell dendrites. PLoS Biol. 6:e103. 10.1371/journal.pbio.0060103 - DOI - PMC - PubMed
    1. Anthony T. E., Mason H. A., Gridley T., Fishell G., Heintz N. (2005). Brain lipid-binding protein is a direct target of Notch signaling in radial glial cells. Genes Dev. 19, 1028–1033. 10.1101/gad.1302105 - DOI - PMC - PubMed
    1. Bao X., Cai Y., Wang Y., Zhao J., He X., Yu D., et al. . (2017). Liver X receptor β is involved in formalin-induced spontaneous pain. Mol. Neurobiol. 54, 1467–1481. 10.1007/s12035-016-9737-1 - DOI - PubMed
    1. Bellamy T. C. (2006). Interactions between Purkinje neurones and Bergmann glia. Cerebellum 5, 116–126. 10.1080/14734220600724569 - DOI - PubMed

LinkOut - more resources