. 2017 Nov 30:8:974.
doi: 10.3389/fphys.2017.00974. eCollection 2017.

Differences in Exercise Capacity and Responses to Training in 24 Inbred Mouse Strains

Affiliations

Differences in Exercise Capacity and Responses to Training in 24 Inbred Mouse Strains

Joshua J Avila et al. Front Physiol. .

Abstract

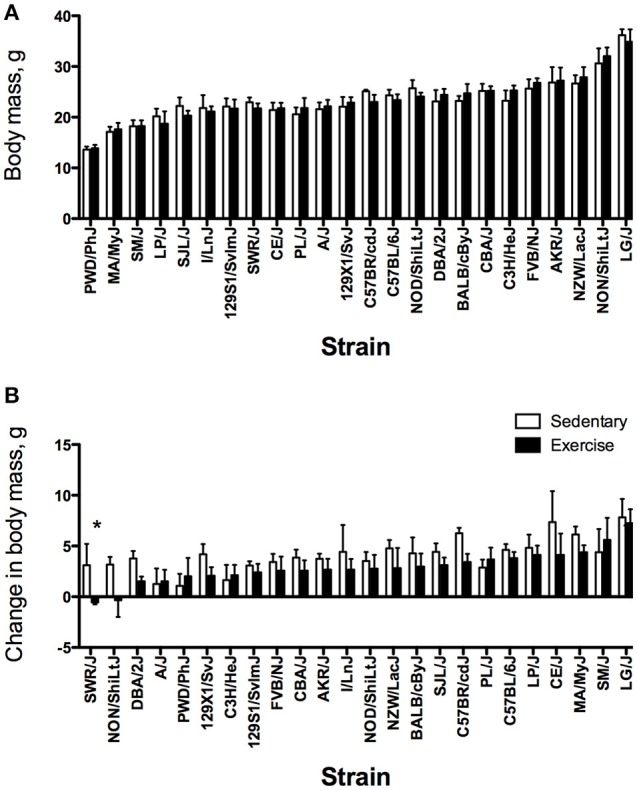
Changes in cardiorespiratory fitness in response to a standardized exercise training protocol differ substantially between individuals. Results from cross-sectional, twin, and family studies indicate genetics contribute to individual differences in both baseline exercise capacity and the response to training. Exercise capacity and responses to training also vary between inbred strains of mice. However, such studies have utilized a limited number of inbred strains. Therefore, the aim of this study was to characterize exercise-training responses in a larger number of genetically diverse strains of inbred mice and estimate the contribution of genetic background to exercise training responses. Eight-week old male mice from 24 inbred strains (n = 4-10/strain) performed a graded exercise test before and after 4 weeks of exercise training. Before training, exercise capacity was significantly different between strains when expressed as time (range = 21-42 min) and work performed (range = 0.42-3.89 kg·m). The responses to training also were significantly different between strains, ranging from a decrease of 2.2 min in NON/ShiLtJ mice to an increase of 8.7 min in SWR/J mice. Changes in work also varied considerably between the lowest (-0.24 kg·m in NON/ShiLtJ) and highest (+2.30 kg·m in FVB/NJ) performing strains. Heart and skeletal muscle masses also varied significantly between strains. Two broad sense heritability estimates were calculated for each measure of exercise capacity and for responses to training. For change in run time, the intraclass correlation between mice within the same inbred strain (rI) was 0.58 and the coefficient of genetic determination (g2) was 0.41. Heritability estimates were similar for the change in work: rI = 0.54 and g2 = 0.37. In conclusion, these results indicate genetic background significantly influences responses to exercise training.

Keywords: exercise training; heart; heritability; inbred strains; muscle; treadmill running.


Figures

Figure 1
Figure 1
Strain distribution pattern for pre-training (baseline) exercise time (A) and change in time (B) in minutes for sedentary (SED) and exercise-trained (EX) mice from 24 inbred strains. For each phenotype, strains are sorted from lowest to highest based on the exercise group. Values are expressed as mean ± SD. *P < 0.05 compared with SED (from ANOVA and Tukey HSD). 129S1/SvImJ (n = 6 for EX, n = 6 for SED), 129X1/SvJ (6, 6), A/J (6, 5), AKR/J (5, 5), BALB/cByJ (6, 6), C3H/HeJ (6, 5), C57BL/6J (6, 6), C57BR/cdJ (6, 6), CBA/J (6, 6), CE/J (6, 6), DBA/2J (6, 6), FVB/NJ (10, 8), I/LnJ (6, 5), LG/J (4, 4), LP/J (6, 6), MA/MyJ (6, 6), NOD/ShiLtJ (6, 6), NON/ShiLtJ (6, 6), NZW/LacJ (6, 6), PL/J (6, 6), PWD/PhJ (6, 5), SJL/J (6, 6), SM/J (6, 6), SWR/J (5, 5).
Figure 2
Figure 2
Strain distribution pattern for pre-training (baseline) work (A) and change in work (B) in kg·m for sedentary (SED) and exercise-trained (EX) mice from 24 inbred strains. For each phenotype, strains are sorted from lowest to highest based on the exercise group. Values are expressed as mean ± SD. n = 4–8/strain for SED and n = 4–10/strain for EX. *P < 0.05 compared with SED (from ANOVA and Tukey HSD).
Figure 3
Figure 3
Strain distribution pattern for pre-training (baseline) body mass (A) and change in body mass (B) in grams for sedentary (SED) and exercise-trained (EX) mice from 24 inbred strains. For each phenotype, strains are sorted from lowest to highest based on the exercise group. Values are expressed as mean ± SD. n = 4–8/strain for SED and n = 4–10/strain for EX. *P < 0.05 compared with SED (from ANOVA and Tukey HSD).
Figure 4
Figure 4
Heart and muscle masses from sedentary (SED) and exercise-trained (EX) mice from 23 inbred strains. (A) Heart mass, mg; (B) Soleus muscle mass, mg; (C) Plantaris muscle mass, mg; and (D) Gastrocnemius muscle mass, mg. Samples were obtained post-intervention. For each phenotype, strains are sorted from lowest to highest based on the exercise cohort. Values are expressed as mean ± SD. n = 4–8/strain for SED and n = 4–10/strain for EX.
Figure 5
Figure 5
Heart and muscle masses relative to body mass from sedentary (SED) and exercise-trained (EX) mice from 23 inbred strains. (A) Heart mass-to-body mass ratio, mg/g; (B) Soleus muscle mass-to-body mass ratio, mg/g; (C) Plantaris muscle mass-to-body mass ratio, mg/g; and (D) Gastrocnemius muscle mass-to-body mass ratio, mg/g. Samples were obtained post-intervention. For each phenotype, strains are sorted from lowest to highest based on the exercise cohort. Values are expressed as mean ± SD. n = 4–8/strain for SED and n = 4–10/strain for EX.

References

    1. Al-Jarrah M., Pothakos K., Novikova L., Smirnova I. V., Kurz M. J., Stehno-Bittel L., et al. . (2007). Endurance exercise promotes cardiorespiratory rehabilitation without neurorestoration in the chronic mouse model of parkinsonism with severe neurodegeneration. Neuroscience 149, 28–37. 10.1016/j.neuroscience.2007.07.038 - DOI - PMC - PubMed
    1. Bamman M. M., Petrella J. K., Kim J. S., Mayhew D. L., Cross J. M. (2007). Cluster analysis tests the importance of myogenic gene expression during myofiber hypertrophy in humans. J. Appl. Physiol. 102, 2232–2239. 10.1152/japplphysiol.00024.2007 - DOI - PubMed
    1. Barbato J. C., Koch L. G., Darvish A., Cicila G. T., Metting P. J., Britton S. L. (1998). Spectrum of aerobic endurance running performance in eleven inbred strains of rats. J. Appl. Physiol. 85, 530–536. - PubMed
    1. Blair S. N., Kohl H. W., III., Barlow C. E., Paffenbarger R. S., Jr., Gibbons L. W., Macera C. A. (1995). Changes in physical fitness and all-cause mortality. a prospective study of healthy and unhealthy men. JAMA 273, 1093–1098. 10.1001/jama.1995.03520380029031 - DOI - PubMed
    1. Blair S. N., Kohl H. W., III., Paffenbarger R. S., Jr., Clark D. G., Cooper K. H., Gibbons L. W. (1989). Physical fitness and all-cause mortality. a prospective study of healthy men and women. JAMA 262, 2395–2401. 10.1001/jama.1989.03430170057028 - DOI - PubMed

LinkOut - more resources