

Alterations in B Cell Compartment Correlate with Poor Neutralization Response and Disease Progression in HIV-1 Infected Children
- PMID: 29250072
- PMCID: PMC5717014
- DOI: 10.3389/fimmu.2017.01697
Alterations in B Cell Compartment Correlate with Poor Neutralization Response and Disease Progression in HIV-1 Infected Children
Abstract
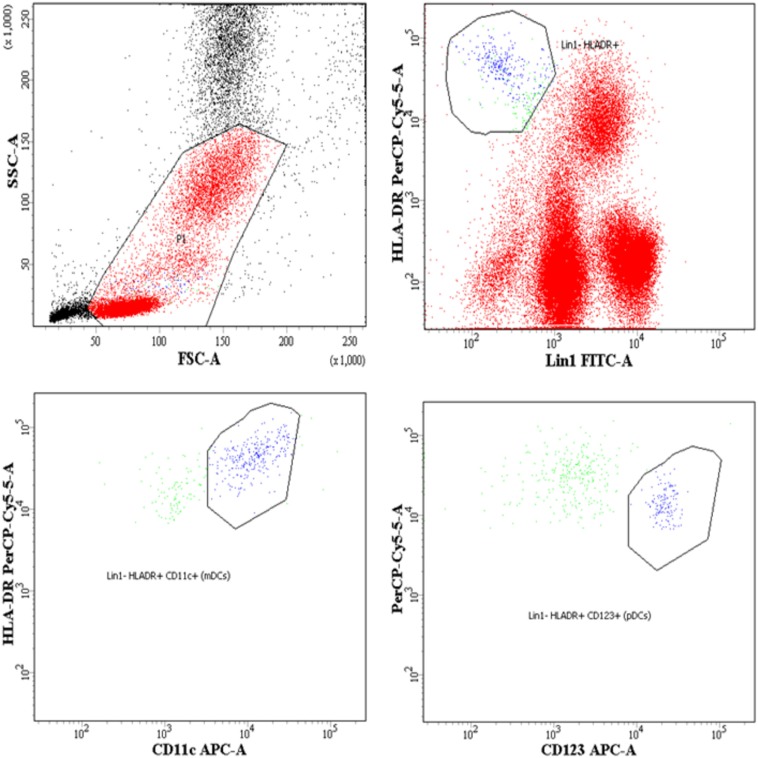
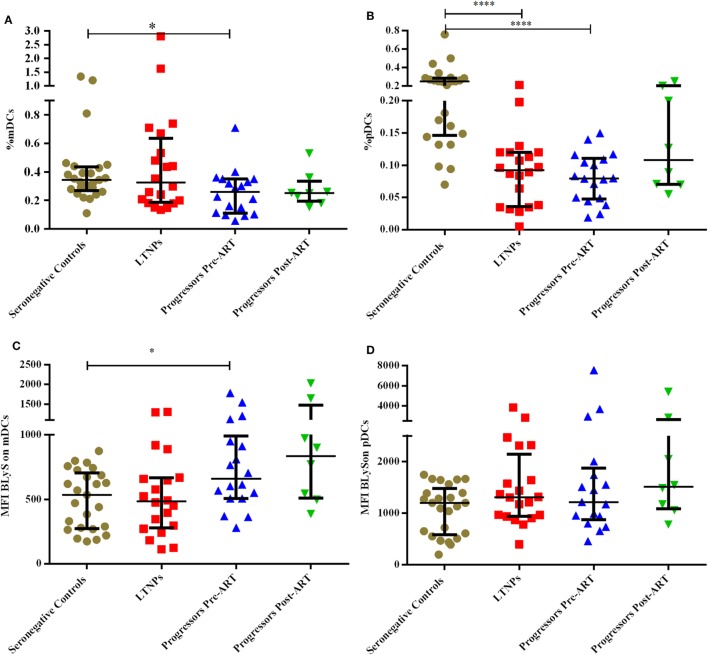
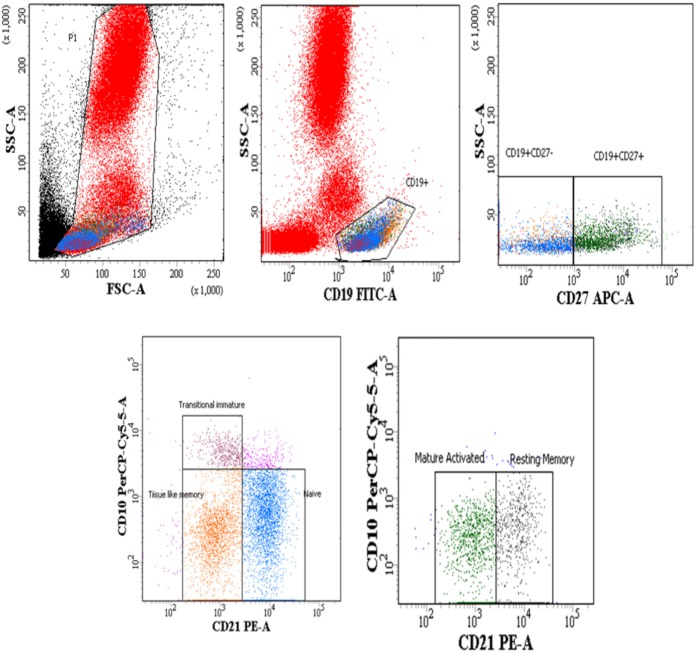
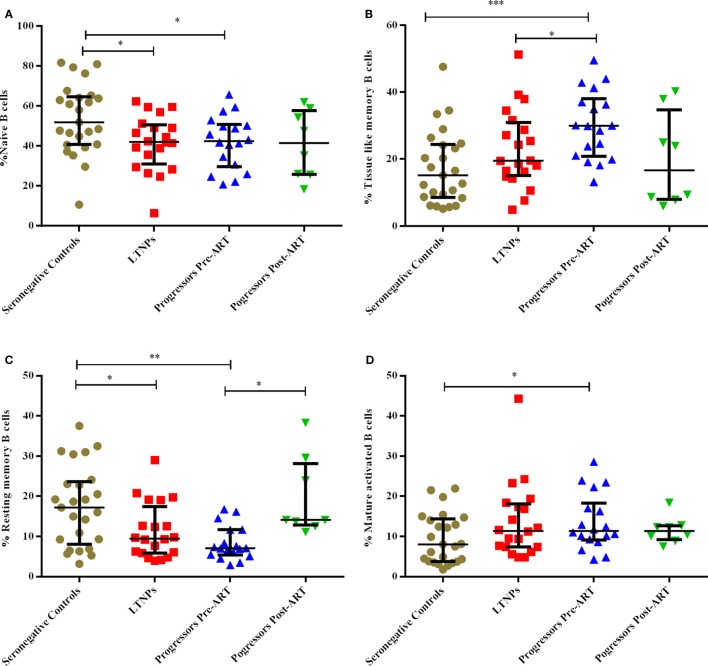
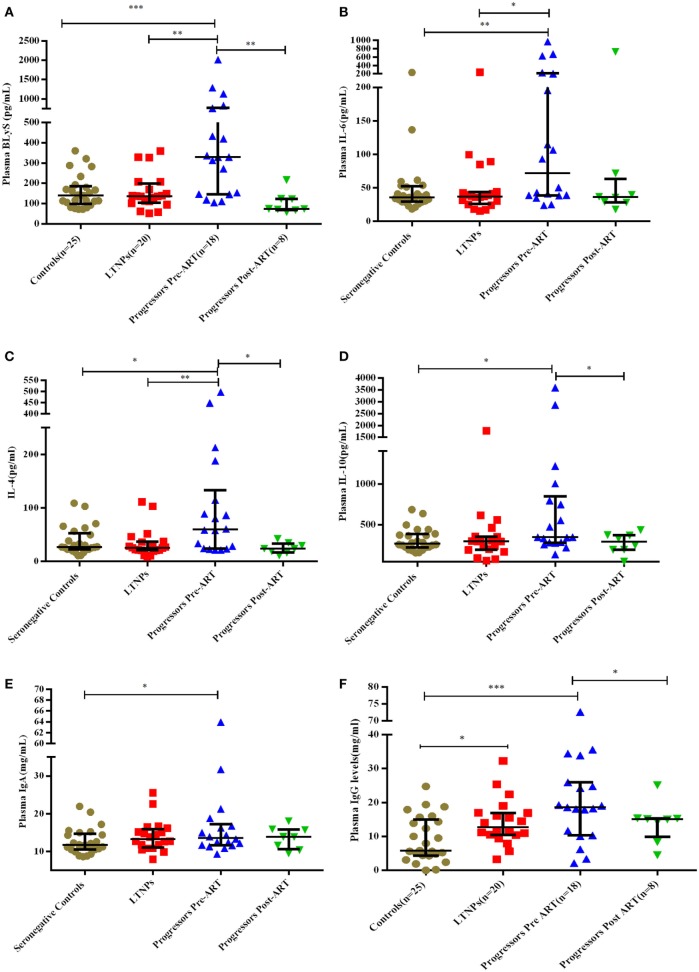
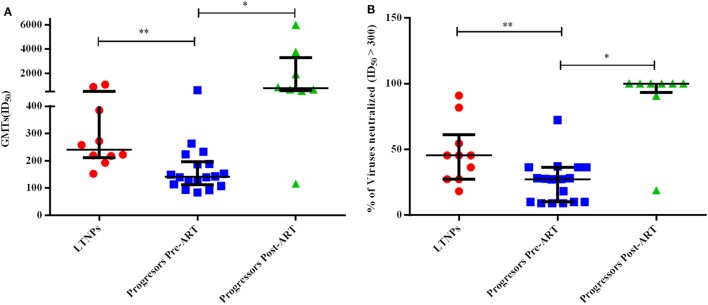
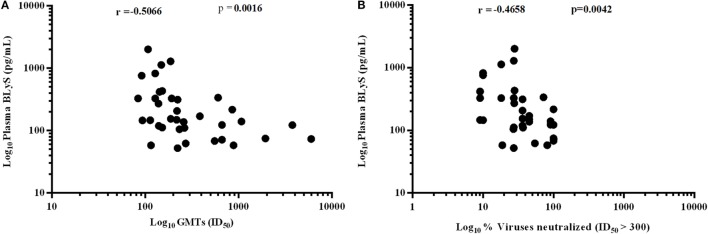
Several B cell defects are reported in HIV-1 infected individuals including variation in B cell subsets, polyclonal B cell activation and exhaustion, with broadly neutralizing antibodies elicited in less than 10-20% of the infected population. HIV-1 disease progression is faster in children than adults. B Lymphocyte Stimulator (BLyS), expressed on dendritic cells (DCs), is a key regulator of B cell homeostasis. Understanding how DCs influence B cell phenotype and functionality (viral neutralization), thereby HIV-1 disease outcome in infected children, is important to develop interventional strategies for restoration of B cell function. In this study, a total of 38 vertically transmitted HIV-1 infected antiretroviral therapy (ART) naïve children and 25 seronegative controls were recruited. Based on the CD4 counts and years post-infection, infected children were categorized as long-term non-progressors (LTNPs) (n = 20) and progressors (n = 18). Eight of these progressors were followed up at 6-12 months post-ART. Percentages (%) of DCs, B cell subsets, and expression of BLyS on DCs were analyzed by flow-cytometry. Plasma levels of B cell growth factors were measured by ELISA and viral neutralization activity was determined using TZM-bl assay. Lower (%) of myeloid DCs (mDCs), plasmacytoid DCs, and high expression of BLyS on mDCs were observed in HIV-1 infected progressors than seronegative controls. Progressors showed lower % of naive B cells, resting memory B cells and higher % of mature activated, tissue-like memory B cells as compared to seronegative controls. Higher plasma levels of IL-4, IL-6, IL-10, and IgA were observed in progressors vs. seronegative controls. Plasma levels of IgG were high in progressors and in LTNPs than seronegative controls, suggesting persistence of hypergammaglobulinemia at all stages of disease. High plasma levels of BLyS in progressors positively correlated with poor viral neutralizing activity. Interestingly on follow up, treatment naïve progressors, post-ART showed increase in resting memory B cells along with reduction in plasma BLyS levels that correlated with improvement in viral neutralization. This is the first study to demonstrate that reduction in plasma BLyS levels correlates with restoration of B cell function, in terms of viral neutralization in HIV-1-infected children.
Keywords: B cells; B lymphocyte stimulator; HIV-1; dendritic cells; long-term non-progressors; neutralizing activity; progressors.
Figures
Similar articles
-
IL-8 Alterations in HIV-1 Infected Children With Disease Progression.Medicine (Baltimore). 2016 May;95(21):e3734. doi: 10.1097/MD.0000000000003734. Medicine (Baltimore). 2016. PMID: 27227934 Free PMC article.
-
High expression levels of B lymphocyte stimulator (BLyS) by dendritic cells correlate with HIV-related B-cell disease progression in humans.Blood. 2011 Jan 6;117(1):145-55. doi: 10.1182/blood-2010-08-301887. Epub 2010 Sep 24. Blood. 2011. PMID: 20870901
-
High expression levels of BLyS/BAFF by blood dendritic cells and granulocytes are associated with B-cell dysregulation in SIV-infected rhesus macaques.PLoS One. 2015 Jun 24;10(6):e0131513. doi: 10.1371/journal.pone.0131513. eCollection 2015. PLoS One. 2015. PMID: 26107380 Free PMC article.
-
Human immunodeficiency virus type 1 long-term non-progressors: the viral, genetic and immunological basis for disease non-progression.J Gen Virol. 2011 Feb;92(Pt 2):247-68. doi: 10.1099/vir.0.027102-0. Epub 2010 Nov 24. J Gen Virol. 2011. PMID: 21106806 Review.
-
Thymic function in HIV-infection.Dan Med J. 2013 Apr;60(4):B4622. Dan Med J. 2013. PMID: 23651726 Review.
Cited by
-
More than the Infinite Monkey Theorem: NHP Models in the Development of a Pediatric HIV Cure.Curr HIV/AIDS Rep. 2024 Feb;21(1):11-29. doi: 10.1007/s11904-023-00686-6. Epub 2024 Jan 16. Curr HIV/AIDS Rep. 2024. PMID: 38227162 Free PMC article. Review.
-
A Rare Mutation in an Infant-Derived HIV-1 Envelope Glycoprotein Alters Interprotomer Stability and Susceptibility to Broadly Neutralizing Antibodies Targeting the Trimer Apex.J Virol. 2020 Sep 15;94(19):e00814-20. doi: 10.1128/JVI.00814-20. Print 2020 Sep 15. J Virol. 2020. PMID: 32669335 Free PMC article.
-
Viral Characteristics Associated with Maintenance of Elite Neutralizing Activity in Chronically HIV-1 Clade C-Infected Monozygotic Pediatric Twins.J Virol. 2019 Aug 13;93(17):e00654-19. doi: 10.1128/JVI.00654-19. Print 2019 Sep 1. J Virol. 2019. PMID: 31217240 Free PMC article.
-
Biological Aging and Immune Senescence in Children with Perinatally Acquired HIV.J Immunol Res. 2020 May 16;2020:8041616. doi: 10.1155/2020/8041616. eCollection 2020. J Immunol Res. 2020. PMID: 32509884 Free PMC article. Review.
-
A gut check: understanding the interplay of the gastrointestinal microbiome and the developing immune system towards the goal of pediatric HIV remission.Retrovirology. 2024 Oct 18;21(1):15. doi: 10.1186/s12977-024-00648-9. Retrovirology. 2024. PMID: 39425183 Free PMC article. Review.
References
-
- Devi NP, Shenbagavalli R, Ramesh K, Rathinam SN, Swaminathan S. Rapid progression of HIV infection in infancy. Indian Pediatr (2009) 46(1):53–6. - PubMed
LinkOut - more resources
Full Text Sources
Other Literature Sources
Research Materials
Miscellaneous