. 2017 Nov 30:8:2060.
doi: 10.3389/fpls.2017.02060. eCollection 2017.

Reconstruction of Oryza sativa indica Genome Scale Metabolic Model and Its Responses to Varying RuBisCO Activity, Light Intensity, and Enzymatic Cost Conditions

Affiliations

Reconstruction of Oryza sativa indica Genome Scale Metabolic Model and Its Responses to Varying RuBisCO Activity, Light Intensity, and Enzymatic Cost Conditions

Ankita Chatterjee et al. Front Plant Sci. .

Abstract

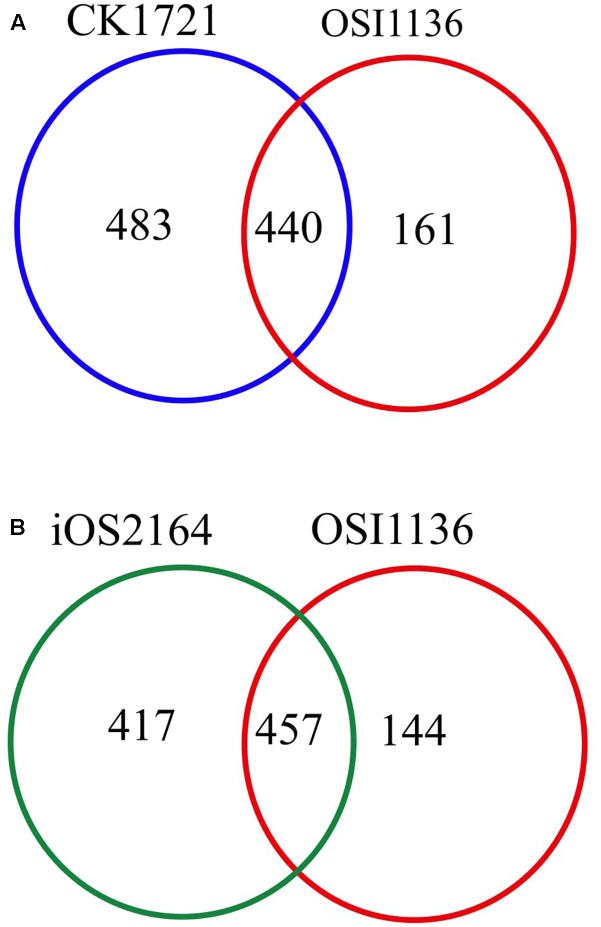
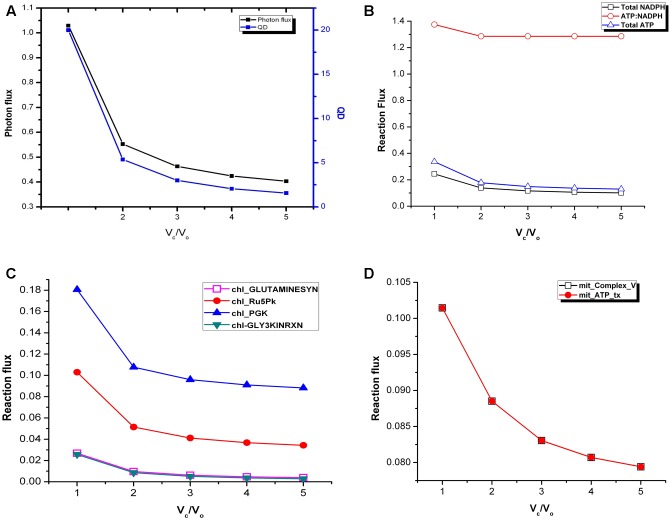
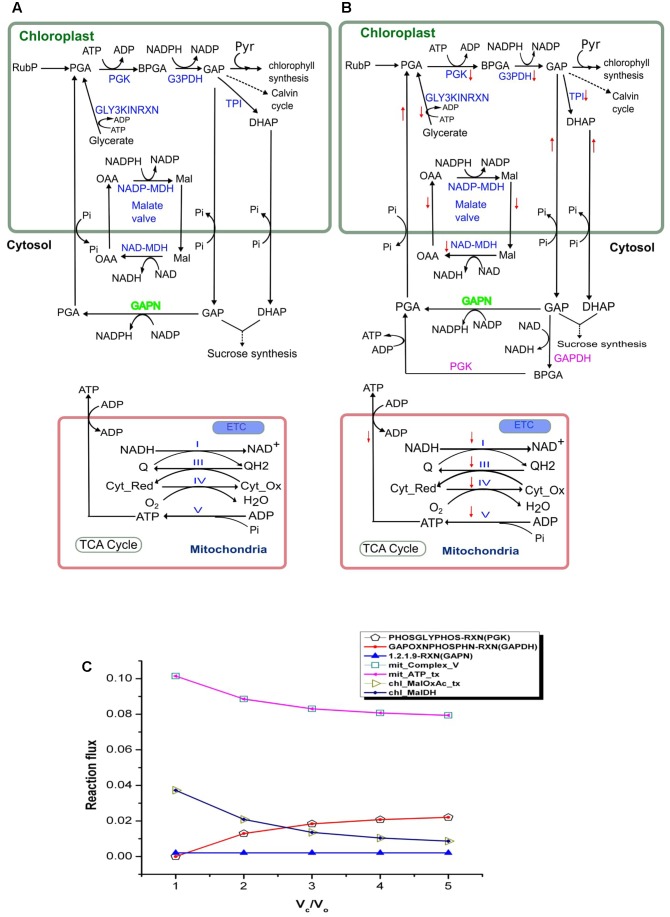
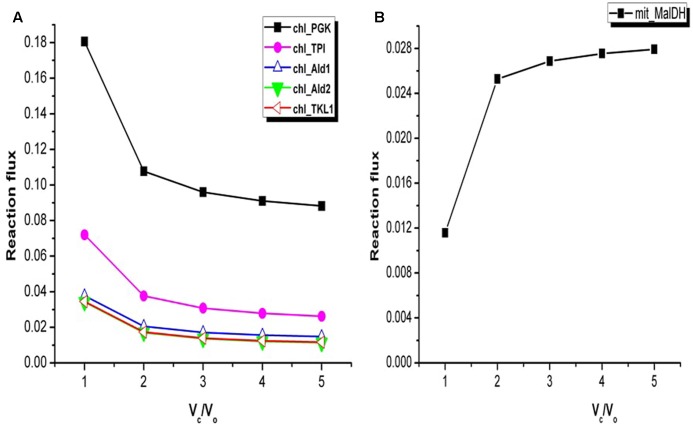
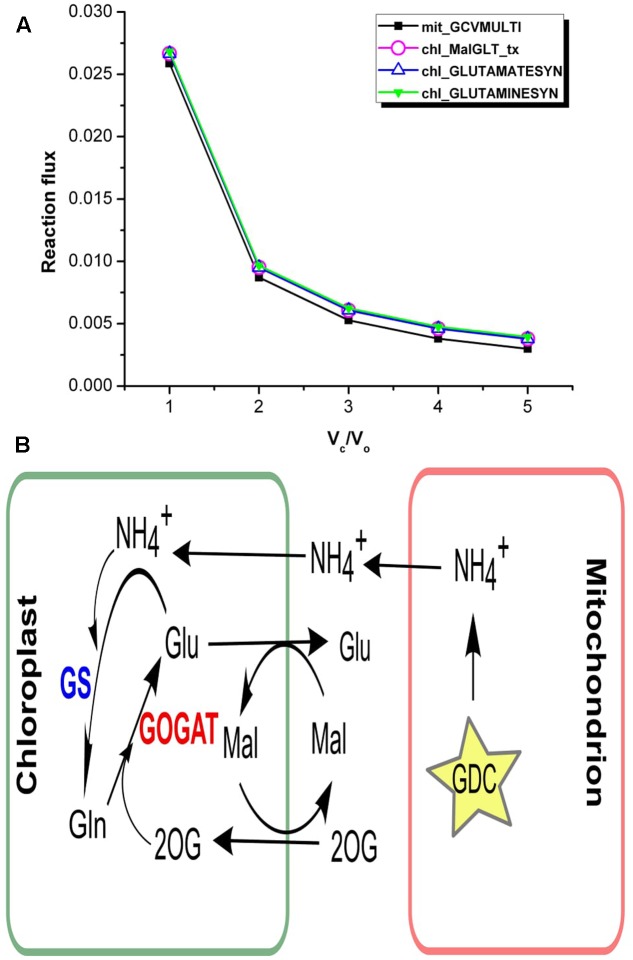
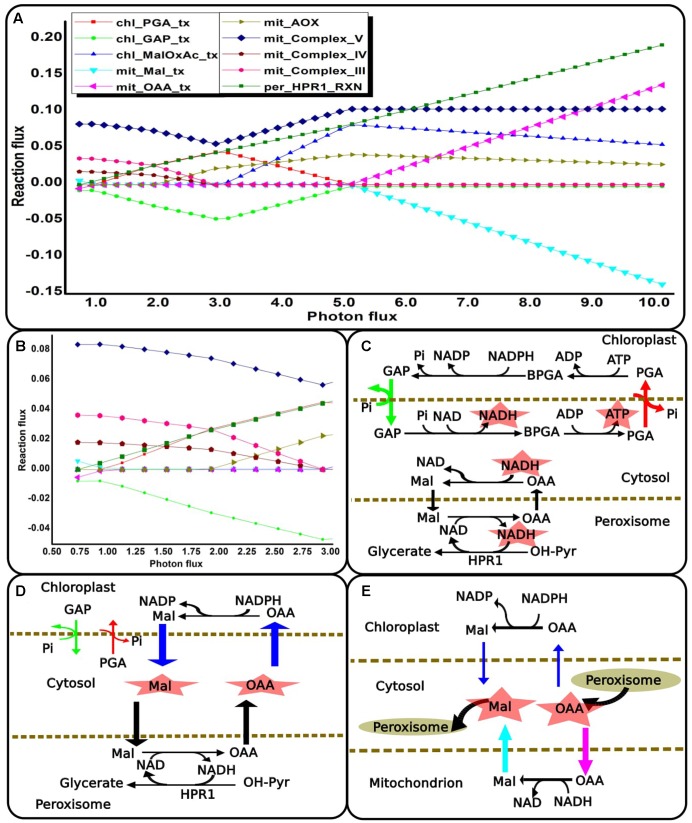
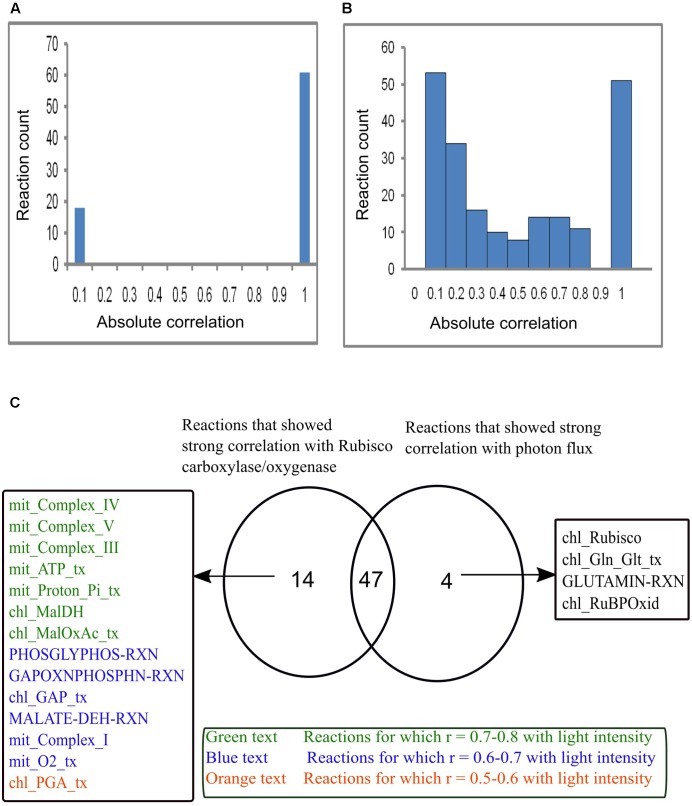
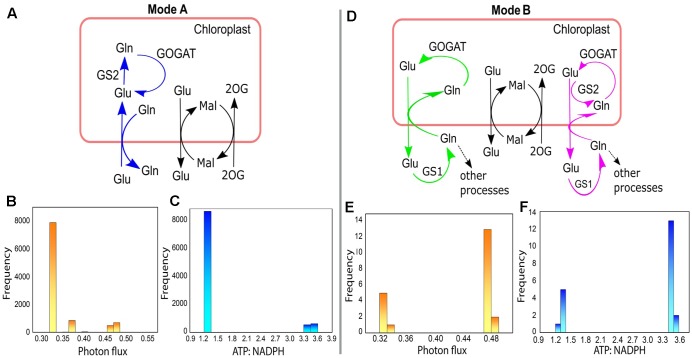
To combat decrease in rice productivity under different stresses, an understanding of rice metabolism is needed. Though there are different genome scale metabolic models (GSMs) of Oryza sativa japonica, no GSM with gene-protein-reaction association exist for Oryza sativa indica. Here, we report a GSM, OSI1136 of O.s. indica, which includes 3602 genes and 1136 metabolic reactions and transporters distributed across the cytosol, mitochondrion, peroxisome, and chloroplast compartments. Flux balance analysis of the model showed that for varying RuBisCO activity (Vc/Vo) (i) the activity of the chloroplastic malate valve increases to transport reducing equivalents out of the chloroplast under increased photorespiratory conditions and (ii) glyceraldehyde-3-phosphate dehydrogenase and phosphoglycerate kinase can act as source of cytosolic ATP under decreased photorespiration. Under increasing light conditions we observed metabolic flexibility, involving photorespiration, chloroplastic triose phosphate and the dicarboxylate transporters of the chloroplast and mitochondrion for redox and ATP exchanges across the intracellular compartments. Simulations under different enzymatic cost conditions revealed (i) participation of peroxisomal glutathione-ascorbate cycle in photorespiratory H2O2 metabolism (ii) different modes of the chloroplastic triose phosphate transporters and malate valve, and (iii) two possible modes of chloroplastic Glu-Gln transporter which were related with the activity of chloroplastic and cytosolic isoforms of glutamine synthetase. Altogether, our results provide new insights into plant metabolism.

Keywords: light intensity; Oryza sativa indica; enzymatic cost; flux balance analysis; metabolic model; photorespiration.


Figures

FIGURE 1
FIGURE 1
Venn diagram showing comparison of the EC numbers corresponding to the respective reactions present in genome scale metabolic models (GSM) of Oryza sativa japonica and Oryza sativa indica. (A) Comparison of EC numbers associated with CK1721 (Chatterjee and Kundu, 2015) and OSI1136. (B) Comparison of EC numbers associated with iOS2164 (Lakshmanan et al., 2015) and OSI1136.
FIGURE 2
FIGURE 2
Variations in photon flux, quantum demand and ATP:NADPH ratio under varying Vc/Vo. (A) The photon flux and the QD were maximum at Vc/Vo = 1. (B) The total ATP and NADPH generated were maximum and minimum at Vc/Vo = 1 and Vc/Vo = 5, respectively. ATP:NADPH ratio was found to be same from Vc/Vo = 2 to Vc/Vo = 5. (C) GS2, chl_Ru5Pk, chl_PGK, and GLYK carried maximum flux at Vc/Vo = 1 and decreased thereafter. (D) The ATP generation through mitochondrial Complex V and its release by the ATP transporter was maximum at Vc/Vo = 1. The reactions present in the chloroplast and mitochondrion are represented by chl_ and mit_ respectively. _tx represents transport reactions.
FIGURE 3
FIGURE 3
Activity of the chloroplastic malate valve, cytosolic GAPDH and PGK and mitochondrial electron transport chain (ETC) at Vc/Vo = 1 and Vc/Vo = 3. Activity of the chloroplastic malate valve, cytosolic GAPDH, PGK and mitochondrial ETC at (A) Vc/Vo = 1 and (B) normal air condition, Vc/Vo = 3. Reactions names in blue indicate the reactions which showed variation in flux; reaction names in green indicate reactions which showed no variation in flux; reaction names in pink are the ones which were not active at Vc/Vo = 1. Down arrow in red represents decrease in flux of the respective reaction. The flux through the chloroplastic triose phosphate transporters (TPT; ‘chl_PGA_tx’, ‘chl_GAP_tx’, and ‘chl_DHAP_tx’) increased at Vc/Vo = 3. (C) Flux plot for reactions catalyzed by PGK (PHOSGLYPHOS -RXN), GAPDH (GAPOXNPHOSPHN -RXN), GAPN (1.2.1.9-RXN), chloroplastic malate dehydrogenase (chl_MalDH), chloroplastic malate-oxaloacetate shuttle (chl_MalOxAc_tx), mitochondrial complex V (mit_Complex_V), and mitochondrial ATP transporter (mit_ATP_tx). The mit_Complex_V, mit_ATP_tx, PHOSGLYPHOS –RXN, GAPOXNPHOSPHN-RXN, chl_MalDH, and chl_MalOxAc_tx carried varying flux while GAPN carried the same flux. PGA, 3-phosphoglycerate; BPGA, 1,3-bisphosphoglycerate; Mal, malate; OAA, oxaloacetic acid; Pyr, pyruvate; GAP, glyceraldehyde-3-phosphate; Cyt_red, reduced cytochrome; Cyt_Ox, oxidized cytochrome. PGK, phosphoglycerate kinase (EC 2.7.2.3); G3PDH, glyceraldehyde-3-phosphate dehydrogenase (EC 1.2.1.13); GAPN, glyceraldehyde-3-phosphate dehydrogenase (NADP+) (EC 1.2.1.9); GAPDH, glyceraldehyde-3-phosphate dehydrogenase (EC 1.2.1.12); TPI, triose-phosphate isomerase (EC 5.3.1.1); NADP-MDH, NADP-dependent malate dehydrogenase (EC 1.1.1.82); NAD-MDH, NAD-dependent malate dehydrogenase (EC 1.1.1.37).
FIGURE 4
FIGURE 4
Variations in the flux of some of the reactions associated with Calvin cycle and mitochondrial malate dehydrogenase. (A) At Vc/Vo = 1 fluxes of reactions associated with Calvin cycle were maximum. Change in fluxes of some of the Calvin cycle reactions are shown here. chl_ represents the chloroplastic reactions. (B) Flux of mitochondrial malate dehydrogenase (mit_MalDH) decreased from Vc/Vo = 5 to Vc/Vo = 1. PGK, phosphoglycerate kinase; TPI, triosephosphate isomerase; Ald1, aldolase 1; Ald2, aldolase 2; TKL1, transketolase 1.
FIGURE 5
FIGURE 5
Interlink in the activities of chloroplastic transporters. (A) Flux plots for mitochondrial GDC catalyzed reaction (mit_GCVMULTI), GS-GOGAT cycle (chl_GLUTAMINESYN and chl_GLUTAMATESYN, respectively) and chl_MalGLT_tx. (B) The GS/GOGAT pathway and associated Mal-Glu and Mal-2OG transporters in plants. Photorespiratory ammonia is completely utilized in GS catalyzed reaction in the chloroplast. GDC, glycine decarboxylase; GS, glutamine synthetase; GOGAT, glutamate synthase; Mal, malate; 2OG, 2ketoglutarate; Glu, glutamate; Gln, glutamine.
FIGURE 6
FIGURE 6
Metabolic readjustments to maintain redox and ATP balance with increasing photorespiration. (A) Flux-plot for reactions and transporters that showed co-ordinated changes that occurred across the light range examined. A negative flux-value of intracellular transporter implies that the metabolite is exported to the cytosol compartment. (B) Enlarged flux-plot for low light intensity (0.73–3.0). (C–E) Metabolic networks corresponding to the flux-plot shown in (A). These show different ways in which the NADH demand of HPR1 can be fulfilled while maintaining cellular ATP balance. The reactions shown in color correspond to their flux-plot. The differences in arrow-width represent changes in respective reaction-fluxes and transporter-fluxes. ‘chl_’ and ‘mit_’ represent reactions in the chloroplast and the mitochondrion. ‘_tx’ represents transporters. HPR1, peroxisomal hydroxypyruvate reductase; GAP, glyceradehyde-3-phosphate; PGA, 3-phosphoglycerate; Pi, inorganic phosphate; BPGA, 1,3-bis-phosphoglycerate; Mal, malate; OAA, oxaloacetic acid; OH-PYR, hydroxypyruvate.
FIGURE 7
FIGURE 7
Reaction flux correlation with RuBisCO carboxylase/oxygenase and light intensity. (A) Reaction flux correlation with RuBisCO carboxylase/oxygenase. (B) Reaction flux correlation with light intensity. These were calculated as the absolute values of the pairwise (Pearson’s) correlation coefficients. The reactions that showed no change in flux were excluded. (C) Venn diagram showing comparison of the reactions that showed strong correlation (correlation coefficient, r varies between 0.9–1) with RuBisCO carboxylase/oxygenase and light intensity. Forty-seven reactions were found to be strongly correlated with both RuBisCO carboxylase/oxygenase and light intensity. Fourteen reactions that were highly correlated with only RuBisCO carboxylase/oxygenase showed varied correlation with light intensity. Four reactions were highly correlated only with light intensity. chl_ and mit_ represent the reactions present in the chloroplast and mitochondrion respectively. _tx represents the transport reactions.
FIGURE 8
FIGURE 8
Different modes of chloroplastic Glu–Gln transporter under varying enzymatic costs. (A) Mode A – chloroplastic Glu–Gln transporter operated to import Glu into the chloroplast and export Gln out of the chloroplast. GS2 was operative but not GS1. (B) Frequency plot showing range of photon flux for Mode A. (C) Frequency plot showing ATP:NADPH ratio for Mode A. (D) Mode B – chloroplastic Glu–Gln transporter operated to export Glu out of the chloroplast and import Gln into the chloroplast. Here, GS2 was not operative (marked in green) except for once when both GS1 and GS2 were active (marked in pink). The transporters for Mal-2OG and Mal-Glu were always operative with the same flux. (E) Frequency plot showing range of photon flux for Mode B. (F) Frequency plot showing ATP:NADPH ratio for Mode B. Glu, glutamate; Gln, glutamine; Mal, malate; 2OG, 2ketoglutarate; GS1, cytosolic glutamine synthetase; GS2, chloroplastic glutamine synthetase; GOGAT, glutamate synthase.

Similar articles

Cited by

References

    1. Araujo W. L., Nunes-Nesi A., Nikoloski Z., Sweetlove L. J., Fernie A. R. (2012). Metabolic control and regulation of the tricarboxylic acid cycle in photosynthetic and heterotrophic plant tissues. Plant Cell Environ. 35 1–21. 10.1111/j.1365-3040.2011.02332.x - DOI - PubMed
    1. Atkin O. K., Macherel D. (2009). The crucial role of plant mitochondria in orchestrating drought tolerance. Ann. Bot. 103 581–597. 10.1093/aob/mcn094 - DOI - PMC - PubMed
    1. Backhausen J. E., Emmerlich A., Holtgrefe S., Horton P., Müller-Röber B., Scheibe R. (1998). Isolated intact chloroplasts and whole leaves from transgenic potato plants with altered levels of chloroplast NADP-MDH: Interactions between photosynthetic electron transport and malate metabolism. Planta 207 105–114. 10.1007/s004250050461 - DOI
    1. Backhausen J. E., Scheibe R. (1999). Adaptation of tobacco plants to elevated CO2: influence of leaf age on changes in physiology, redox states and NADP-malate dehydrogenase activity. J. Exp. Bot. 50 665–675. 10.1093/jxb/50.334.665 - DOI
    1. Basu S., Ramegowda V., Kumar A., Pereira A. (2016). Plant adaptation to drought stress. F1000Res. 5 F1000FacultyRev–1554. 10.12688/f1000research.7678.1 - DOI - PMC - PubMed