Review
. 2016 Dec 31;9(4):1444.
doi: 10.4022/jafib.1444. eCollection 2016 Dec.

Basic Properties And Clinical Applications Of The Intracardiac

Affiliations
Review

Basic Properties And Clinical Applications Of The Intracardiac

Francesco Zanon et al. J Atr Fibrillation. .

Abstract

The electric signals detected by intracardiac electrodes provide information on the occurrence and timing of myocardial depolarization, but are not generally helpful to characterize the nature and origin of the sensed event. A novel recording technique referred to as intracardiac ECG (iECG) has overcome this limitation. The iECG is a multipolar signal, which combines the input from both atrial and ventricular electrodes of a dual-chamber pacing system in order to assess the global electric activity of the heart. The tracing resembles a surface ECG lead, featuring P, QRS and T waves. The time-course of the waveform representing ventricular depolarization (iQRS) does correspond to the time-course of the surface QRS with any ventricular activation modality. Morphological variants of the iQRS waveform are specifically associated with each activity pattern, which can therefore be diagnosed by evaluation of the iECG tracing. In the event of tachycardia, SVTs with narrow QRS can be distinguished from other arrhythmia forms based upon the preservation of the same iQRS waveform recorded in sinus rhythm. In ventricular capture surveillance, real pacing failure can be reliably discriminated from fusion beats by the analysis of the area delimited by the iQRS signal. Assessing the iQRS waveform correspondence with a reference template could be a way to check the effectiveness of biventricular pacing, and to discriminate myocardial capture alone from additional His bundle recruitment in para-Hisian stimulation. The iECG is not intended as an alternative to conventional intracavitary sensing, which remains the only tool suitable to drive the sensing function of a pacing device. Nevertheless, this new electric signal can add the benefits of morphological data processing, which might have important implications on the quality of the pacing therapy.

Keywords: CRT; Cardiac electrograms; Fusion detection; Hisian pacing.


Figures

Figure 1.
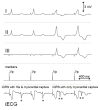
Figure 1.. From top to bottom: surface ECG leads I, II, III, pacemaker event markers (As: atrial sensing; Vs: right ventricular sensing), intracardiac ECG (iECG, scaled in arbitrary units). The same tracings are displayed in the next figures. Sinus rhythm with intrinsic AV conduction and narrow QRS. Surface QRS and iQRS feature a similar time-course (iQRS onset and trailing edge are marked by dashed vertical lines). Full description in the main text.
Figure 2.
Figure 2.. Sinus rhythm and intrinsic AV conduction with (A) LBBB and (B) RBBB. The iQRS onset and trailing edge are marked by dashed vertical lines. Note the prolonged latency between the iQRS onset and the ventricular sensing marker (*) in the presence of RBBB.
Figure 3.
Figure 3.. First degree AVB (PQ = 304 ± 2 ms). The iQRS features different specific morphology in case of AV conduction (*) or each of two PVC types (**, ***). Note the overlapping of PVCs and previous iP waveforms
Figure 4.
Figure 4.. Linear relationship between surface QRS and iQRS duration in 13 patients. Ventricular pacing and different kinds of intrinsic activity (AV conduction with narrow QRS, LBBB, RBBB, PVCs) are pooled in the same plot, for a total of 30 paired determinations. The global least square line demonstrates a high correlation, with slope and intercept close to 1 and 0, respectively, indicating that the two variables are equivalent.
Figure 5.
Figure 5.. Para-Hisian pacing with myocardial capture only. The emission of a pacing pulse is marked as Vp. A: threshold test in VVI (90 bpm). The third spike is ineffective and no electric signal but the stimulation artifact is detected on the iECG tracing. The fourth spike is ineffective as well, though it falls right at the onset of a QRS complex, as both the surface ECG and the iECG feature their intrinsic conduction pattern and the ventricular activity is preceded by a sinus P-wave (*). The iECG ventricular signal is different in the presence of capture (1st and 2nd cycles; note the iQRS peak saturation with the applied gain) and in this patient it shows a fast deflection at the beginning of the iT-wave, indicating pacing-induced retroconduction (**). B: VDD pacing with 200 ms AV delay. This interval is quite similar to the intrinsic PR detected by the pacemaker, so that pacing inhibition takes place in the 2nd and 3rd cycle. In contrast, a pacing pulse is released in the 1st and 4th cycles, resulting in pseudofusion. The intrinsic iQRS is detected in all instances. In addition, it is noteworthy that the P-wave recorded in the 2nd cycle (***) is different from the sinus P-waves (*) both on the iECG and the surface ECG leads.
Figure 6.
Figure 6.. Same case as in Fig. 5. VDD pacing with AV delay of 150 ms (A), 100 ms (B) and 50 ms (C), with correspondingly lower degree of fusion. Sequential atrium-driven pacing removed the fast deflection following the paced iQRS in VVI (Fig. 5), confirming that it actually was a retrograde P-wave.
Figure 7.
Figure 7.. Same case as in Fig. 5. VDD pacing with AV delay set at 200 ms (A) and 100 ms (B, C). In panel A, ventricular sensing (Vs) and pseudofusion (Vp) alternates in two consecutive cycles. Panel B and C show, respectively, effective stimulation with fully evoked QRS and capture loss, followed by intrinsic conduction. The area delimited by the iQRS waveform was measured in the interval from 30 ms before to 70 ms after the ventricular marker (dashed lines), considering the absolute value of the voltage and removing the stimulation artifact by a 20 ms blanking triggered by the spike (lowest tracing). Note that the iQRS area is much smaller in C than in any other condition, pseudofusion included.
Figure 8.
Figure 8.. The histogram represents the area under the iQRS signal measured with different AV delays in VDD pacing mode. Data derived from the tracings shown in Fig. 5 and 6 are expressed as the ratio between the average area of the paced and sensed waveforms, ± the standard error of the quotient according to the error propagation theory. Both effective and ineffective stimulation (with pulse amplitude set just below the threshold) were performed at 100 ms AV delay.
Figure 9.
Figure 9.. Pacing lead in the Hisian region in a patient with 2:1 AV block. A: VVI mode with basic rate of 30 bpm (A), resulting in pacing inhibition. Though ventricular markers only are displayed, iP-waves are easily recognized on the iECG (*). In addition, hidden iP-signals are likely fused with the iT waveform, which shows remarkable beat-to-beat variability (**). B: VVI pacing at 60 bpm, with capture of the His bundle. Both the iECG and the surface ECG feature the same ventricular complex as in panel A, demonstrating that the physiological conduction pattern was maintained.
Figure 10.
Figure 10.. Pacing lead in the para-Hisian region. Ventricular threshold test in VVI: all the spikes are effective, but the QRS complex suddenly changes during the energy scan, when Hisian capture is lost and fusion is replaced by pure myocardial stimulation. The iQRS waveform is consistently modified (duration 95 ± 3 ms and 110 ± 5 ms, respectively, in presence or absence of Hisian recruitment). At the same time, the sinus P-waves (*) are replaced by retroconduction (**).
Figure 11.
Figure 11.. DDD pacing with (A): bipolar right ventricular stimulation; (B): unipolar left ventricular stimulation; (C): biventricular stimulation; in a chronic biventricular implant. The iQRS waveform is different in each ventricular activation modality, featuring a duration of 248, 256, and 170 ms in panel A, B and C, respectively.

References

    1. Irnich W. Intracardiac electrograms and sensing test signals: electrophysiological, physical, and technical considerations. Pacing Clin Electrophysiol. 1985 Nov;8 (6):870–88. - PubMed
    1. Glikson Michael, Swerdlow Charles D, Gurevitz Osnat T, Daoud Emile, Shivkumar Kalyanam, Wilkoff Bruce, Shipman Tamara, Friedman Paul A. Optimal combination of discriminators for differentiating ventricular from supraventricular tachycardia by dual-chamber defibrillators. J. Cardiovasc. Electrophysiol. 2005 Jul;16 (7):732–9. - PubMed
    1. Francia Pietro, Balla Cristina, Uccellini Arianna, Cappato Riccardo. Arrhythmia detection in single- and dual-chamber implantable cardioverter defibrillators: the more leads, the better? J. Cardiovasc. Electrophysiol. 2009 Sep;20 (9):1077–82. - PubMed
    1. Stambler Bruce S. ICD arrhythmia detection and discrimination algorithms: whose is best? J. Cardiovasc. Electrophysiol. 2012 Apr;23 (4):367–9. - PubMed
    1. Theuns Dominic A M J, Rivero-Ayerza Maximo, Goedhart Dick M, Miltenburg Max, Jordaens Luc J. Morphology discrimination in implantable cardioverter-defibrillators: consistency of template match percentage during atrial tachyarrhythmias at different heart rates. Europace. 2008 Sep;10 (9):1060–6. - PubMed

LinkOut - more resources