. 2017 Jul;3(No 3):035001.
doi: 10.1117/1.JATIS.3.3.035001. Epub 2017 Jul 17.

λ = 2.4 - 5 μ m spectroscopy with the JWST NIRCam instrument

Affiliations

λ = 2.4 - 5 μ m spectroscopy with the JWST NIRCam instrument

Thomas P Greene et al. J Astron Telesc Instrum Syst. 2017 Jul.

Abstract

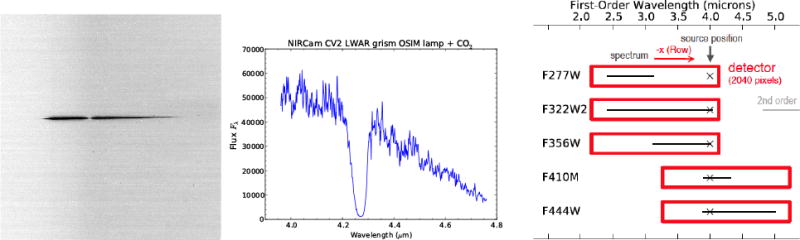
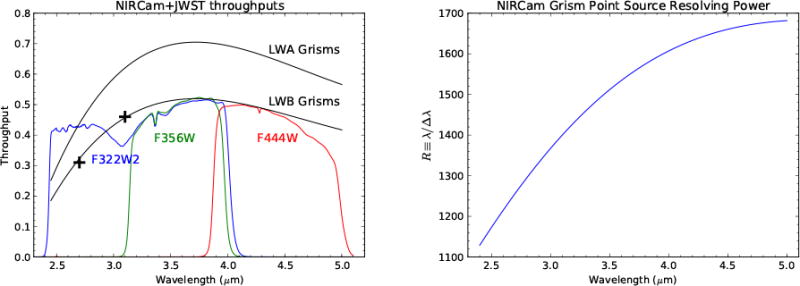
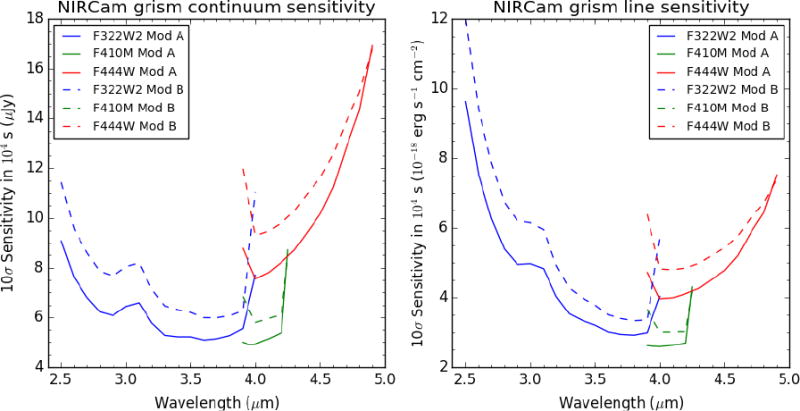
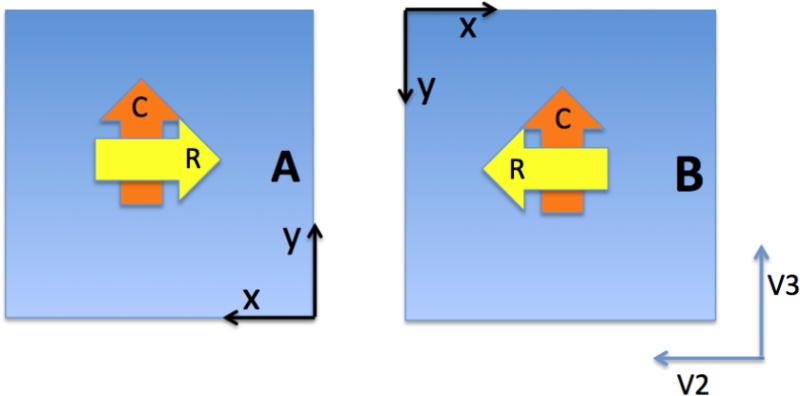
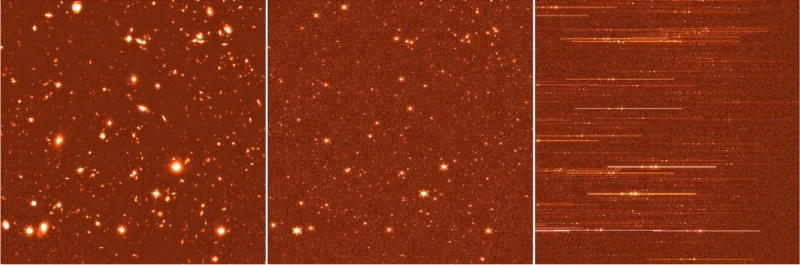
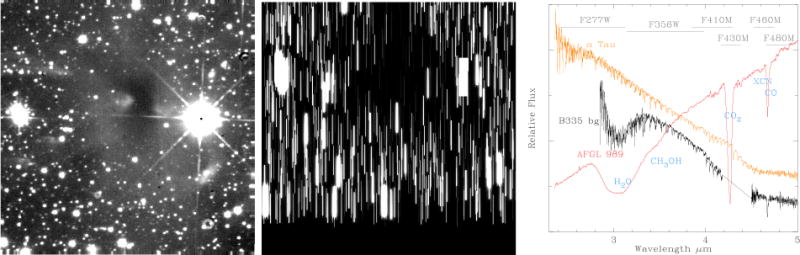
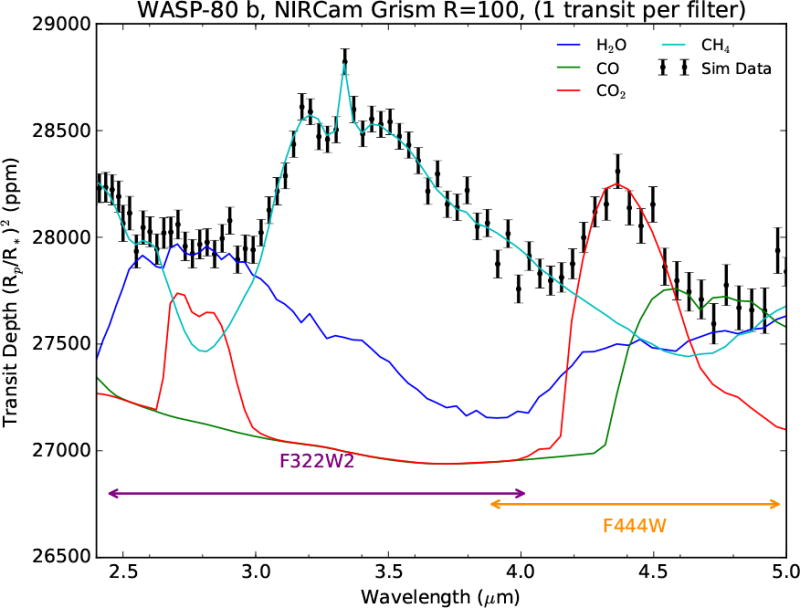
The James Webb Space Telescope near-infrared camera (JWST NIRCam) has two 2'. 2 × 2'.2 fields of view that can be observed with either imaging or spectroscopic modes. Either of two R ∼ 1500 grisms with orthogonal dispersion directions can be used for slitless spectroscopy over λ = 2.4 - 5.0 μm in each module, and shorter wavelength observations of the same fields can be obtained simultaneously. We describe the design drivers and parameters of the grisms and present the latest predicted spectroscopic sensitivities, saturation limits, resolving powers, and wavelength coverage values. Simultaneous short wavelength (0.6 - 2.3 μm) imaging observations of the 2.4 - 5.0 μm spectroscopic field can be performed in one of several different filter bands, either in-focus or defocused via weak lenses internal to NIRCam. The grisms are available for single-object time series spectroscopy and wide-field multi-object slitless spectroscopy modes in the first cycle of JWST observations. We present and discuss operational considerations including subarray sizes and data volume limits. Potential scientific uses of the grisms are illustrated with simulated observations of deep extragalactic fields, dark clouds, and transiting exoplanets. Information needed to plan observations using these spectroscopic modes are also provided.

Keywords: cameras; gratings; infrared spectroscopy; satellites; space optics.


Figures

Fig 1
Fig 1
Left: NIRCam spectral image of the OSIM super-continuum lamp taken with the LWA R grism and F444W filter during JWST instrument instrument testing at NASA GSFC in August 2014. The image is oriented so that detector × coordinates increase to the left and wavelength increases to the right. Center: Extracted spectrum from the image with an approximate wavelength calibration applied. The continuum decreases toward longer wavelengths due to low fiber transmittance, and the broad feature near 4.27 μm is due to CO2 absorption. Both of these features are artifacts of the test equipment and not NIRCam itself. Right: Layout of an object's LW R grism spectra spectrum relative to its direct image position for different filters (image courtesy of D. Coe).
Fig 2
Fig 2
Left: Total system throughput including all OTE and NIRCam optics and the detector quantum efficiency for several NIRCam filters (Module A optics and QE shown; Module B is similar). The theoretical LW grism efficiency curves must be multiplied by the optics curves for a chosen filter to produce the system throughput at each wavelength. The Module B LW grisms are anti-reflection coated on only one side and therefore have throughputs approximately 25% lower than the LWA grisms. Module B grism throughputs were measured at 2 wavelengths and are shown as crosses. Right: Spline curve fit to the grism FWHM spectral resolving power R vs. wavelength for point sources. This is limited by pixel sampling of the PSF at shorter wavelengths (λ ≲ 4 μm) and limited by diffraction and the quasi-hexagonal pupil shape at longer wavelengths (λ ≳ 4 μm).
Fig 3
Fig 3
Point-source continuum (left) and emission line (right) sensitivities are shown for grisms with F322W2, F410M, and F444W filters for both Modules A and B. Note that the narrower bandwidth of the F410 filters results in significantly better sensitivity than the wider F444W at common wavelengths.
Fig 4
Fig 4
Grism dispersion orientations along detector axes (x, y) and the JWST observatory axes (V2, V3). The V3 position angle is defined to be 0 degrees when V2 points toward East and V3 points North on the sky. The yellow and orange arrows point in the direction of increasing wavelength for R and C grisms respectively in modules A (left) and B (right). Each module has a 2′.2 × 2′.2 imaging field of view.
Fig 5
Fig 5
Left: HST/WFC3-IR F160W image of the Hubble eXtreme Deep Field (XDF) covering the area around the Hubble Ultra-Deep Field (HUDF). The total exposure time is ∼65 hours over most of the image; Center: 2-hour JWST NIRCam image in the F356W filter simulated with the source catalog produced from the XDF F160W image on the left. For simplicity, all the sources were assumed to be point-like (i.e., represented by the simulated WebbPSF F356W PSF) and m356,AB = m160,AB; Right: Simulated 2-hour NIRCam Module A R grism data with the F356W filter. The input model spectrum was constructed as a combination of a flat Fν flux continuum and three emission lines, Hβ and [O III] 4959/5007 Å lines, with rest-frame equivalent widths of ∼180, 200, and 600 Å, respectively (the line widths are unresolved). All sources were redshifted to z = 6 to illustrate the detectability of the three emission lines as function of source brightness. The images are oriented with North up and East to the left, and wavelength increases to the right (as in Fig. 4 with V3 PA = 0 deg.)
Fig 6
Fig 6
Left: B335 dark coud K-band (λ = 2.2 μm) UKIRT image acquired in 3.2 h integration time. Center: Simulated 0.45 h JWST NIRCam spectral image using the Module A C grism and F430M filter, using simulated PSFs for K = 20 mag (Vega) and brighter stars in the UKIRT data, and fainter stars added using the TRILEGAL background model with measured extinctions applied. Spectra are vertically offset from the UKIRT image because the λ = 4.0 μm undeviated wavelength is outside of the bandpass of the F430M filter. Right: Interstellar ice spectra are shown with NIRCam filter bandpasses. A star behind the B335 cloud (black) is the same spectral type as α Tau (orange), but it shows λ = 3 μm H2O and CO ice absorption due to the intervening B335 cloud. The Infrared Space Observatory spectrum of AFGL 98937 shows numerous strong and weak ice features that NIRCam will detect and measure, including λ = 4.3 μm CO2 absorptions from ice mantles forming on dust grains in the cloud.
Fig 7
Fig 7
Simulated transmission spectrum (black points with error bars) for the gas giant planet WASP-80 b when observing with a NIRCam LWA grism paired with the F322W2 filter for one transit and with the F444W filter for one other transit, binned to R = 100. We model the planet's spectrum with CHIMERA, assuming a uniform temperature of 810 K, 7.5 times solar metallicity, and molecular mixing ratios consistent with chemical equilibrium. The figure shows the contributions of H2O (water), CO (carbon monoxide), CO2 (carbon dioxide), and CH4 (methane) to the spectrum. The NIRCam grism modes are especially sensitive to the carbon-bearing molecules. The wavelength coverages of each individual transit for the F322W2 and F444W filters are also shown near the bottom of the plot.

References

    1. Beichman CA, Rieke M, Eisenstein D, et al. Science opportunities with the near-IR camera (NIRCam) on the James Webb Space Telescope (JWST) Space Telescopes and Instrumentation 2012: Optical, Infrared, and Millimeter Wave, Proceedings of the SPIE. 2012;8442:84422N.
    1. Krist JE, Beichman CA, Trauger JT, et al. Hunting planets and observing disks with the JWST NIRCam coronagraph. Techniques and Instrumentation for Detection of Exo-planets III, Proceedings of the SPIE. 2007;6693:66930H.
    1. Rieke MJ, Kelly D, Horner S. Overview of James Webb Space Telescope and NIR-Cam's Role,” in Cryogenic Optical Systems and Instruments XI. In: Heaney JB, Burriesci LG, editors. Proceedings of the SPIE. Vol. 5904. 2005. pp. 1–8.
    1. Greene T, Beichman C, Eisenstein D, et al. Observing exoplanets with the JWST NIRCam grisms. Techniques and Instrumentation for Detection of Exoplanets III, Proceedings of the SPIE. 2007;6693:66930G.
    1. Greene TP, Chu L, Egami E, et al. Slitless spectroscopy with the James Webb Space Telescope Near-Infrared Camera (JWST NIRCam) Society of Photo-Optical Instrumentation Engineers (SPIE) Conference Series, Proceedings of the SPIE. 2016;9904:99040E.

LinkOut - more resources