

Functional connectivity based parcellation of early visual cortices
- PMID: 29250855
- PMCID: PMC6866351
- DOI: 10.1002/hbm.23926
Functional connectivity based parcellation of early visual cortices
Abstract
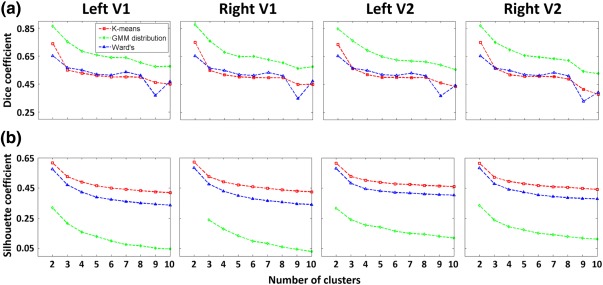
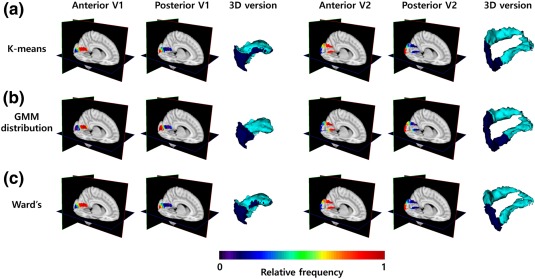
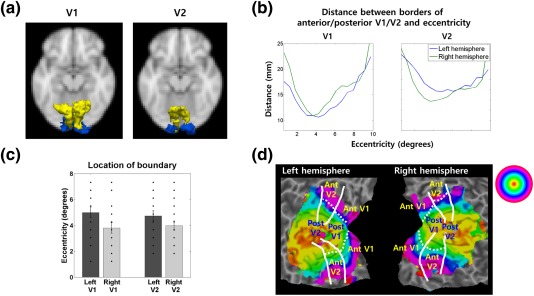
Human brain can be divided into multiple brain regions based on anatomical and functional properties. Recent studies showed that resting-state connectivity can be utilized for parcellating brain regions and identifying their distinctive roles. In this study, we aimed to parcellate the primary and secondary visual cortices (V1 and V2) into several subregions based on functional connectivity and to examine the functional characteristics of each subregion. We used resting-state data from a research database and also acquired resting-state data with retinotopy results from a local site. The long-range connectivity profile and three different algorithms (i.e., K-means, Gaussian mixture model distribution, and Ward's clustering algorithms) were adopted for the parcellation. We compared the parcellation results within V1 and V2 with the eccentric map in retinotopy. We found that the boundaries between subregions within V1 and V2 were located in the parafovea, indicating that the anterior and posterior subregions within V1 and V2 corresponded to peripheral and central visual field representations, respectively. Next, we computed correlations between each subregion within V1 and V2 and intermediate and high-order regions in ventral and dorsal visual pathways. We found that the anterior subregions of V1 and V2 were strongly associated with regions in the dorsal stream (V3A and inferior parietal gyrus), whereas the posterior subregions of V1 and V2 were highly related to regions in the ventral stream (V4v and inferior temporal gyrus). Our findings suggest that the anterior and posterior subregions of V1 and V2, parcellated based on functional connectivity, may have distinct functional properties.
Keywords: dorsal and ventral streams; functional connectivity; parcellation; peripheral and foveal visual field representations; resting-state fMRI; visual cortex.
© 2017 Wiley Periodicals, Inc.
Conflict of interest statement
None.
Figures

References
-
- Amunts, K. , Schleicher, A. , & Zilles, K. (2007). Cytoarchitecture of the cerebral cortex‐More than localization. NeuroImage, 37, 1061–1065. - PubMed
-
- Amunts, K. , Malikovic, A. , Mohlberg, H. , Schormann, T. , & Zilles, K. (2000). Brodmann's areas 17 and 18 brought into stereotaxic space‐where and how variable? NeuroImage, 11, 66–84. - PubMed
-
- Baldassano, C. , Fei‐Fei, L. , & Beck, D. M. (2016). Pinpointing the peripheral bias in neural scene processing networks during natural viewing. Journal of Vision, 16, 9. - PubMed
-
- Barbier, E. L. , Marrett, S. , Danek, A. , Vortmeyer, A. , Van Gelderen, P. , Duyn, J. , … Koretsky, A. P. (2002). Imaging cortical anatomy by high‐resolution MR at 3.0T: Detection of the stripe of Gennari in visual area 17. Magnetic Resonance in Medicine, 48, 735–738. - PubMed
Publication types
MeSH terms
Grants and funding
LinkOut - more resources
Full Text Sources
Other Literature Sources
