. 2017 Dec 18:6:e28070.
doi: 10.7554/eLife.28070.

Free-living human cells reconfigure their chromosomes in the evolution back to uni-cellularity

Affiliations

Free-living human cells reconfigure their chromosomes in the evolution back to uni-cellularity

Jin Xu et al. Elife. .

Abstract

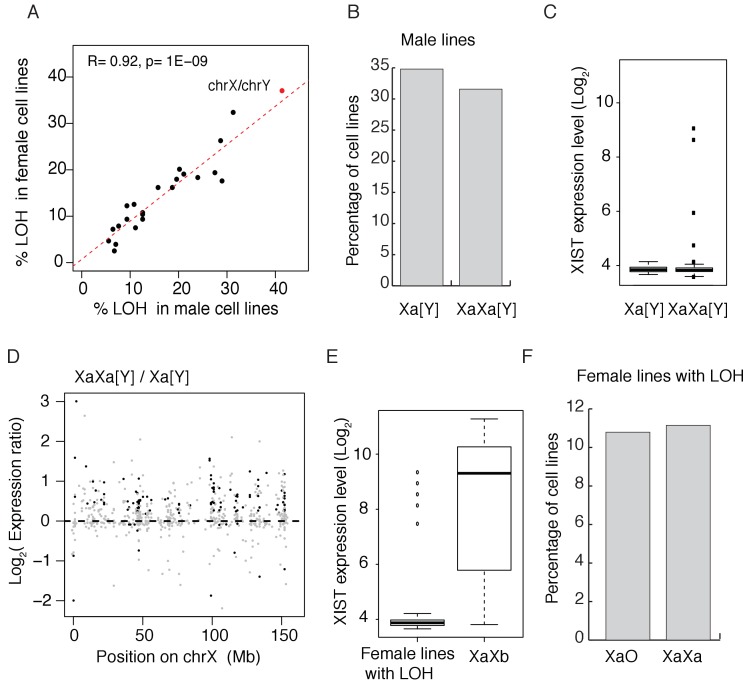
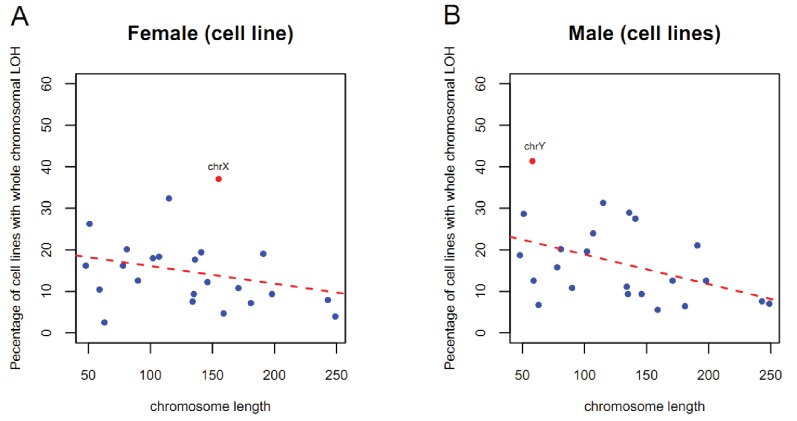
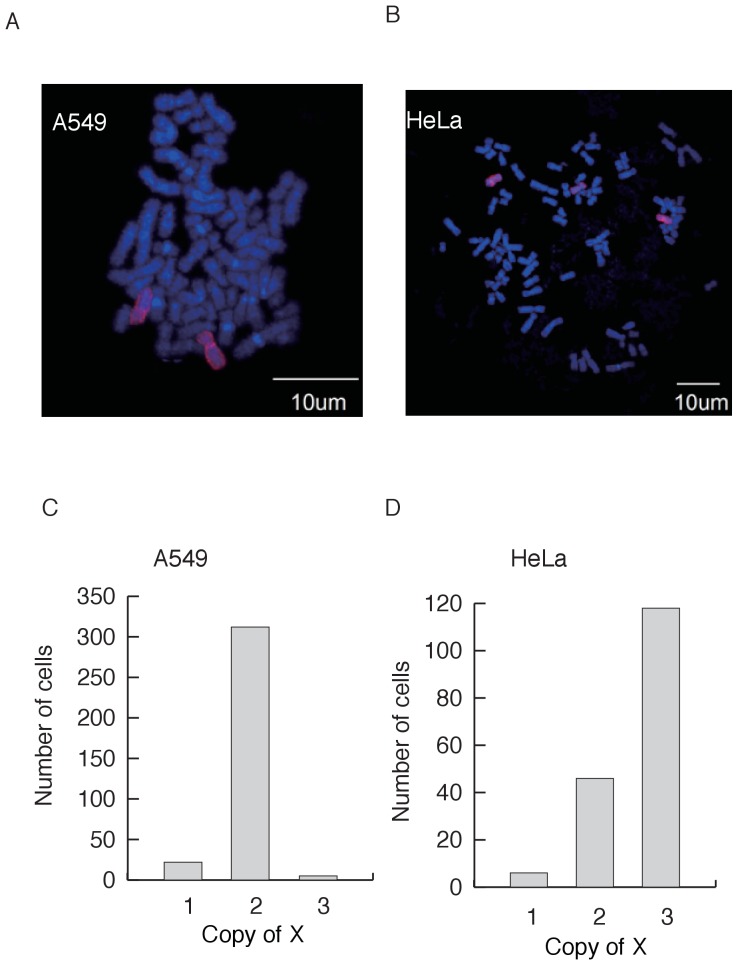
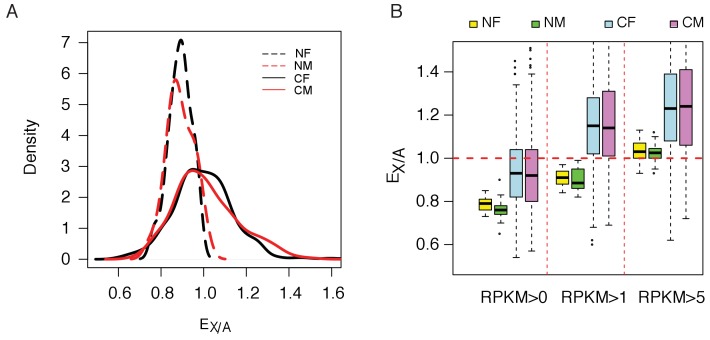
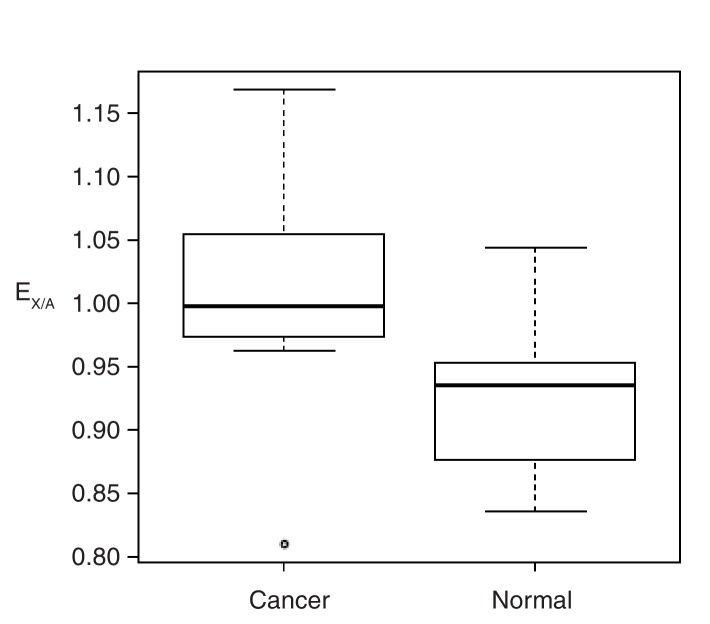
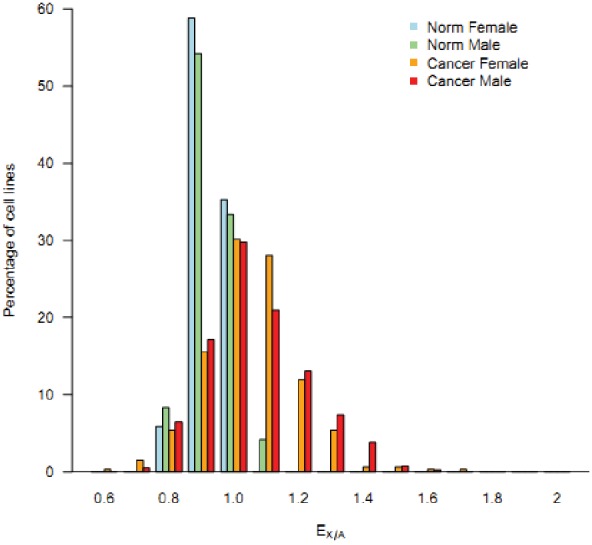
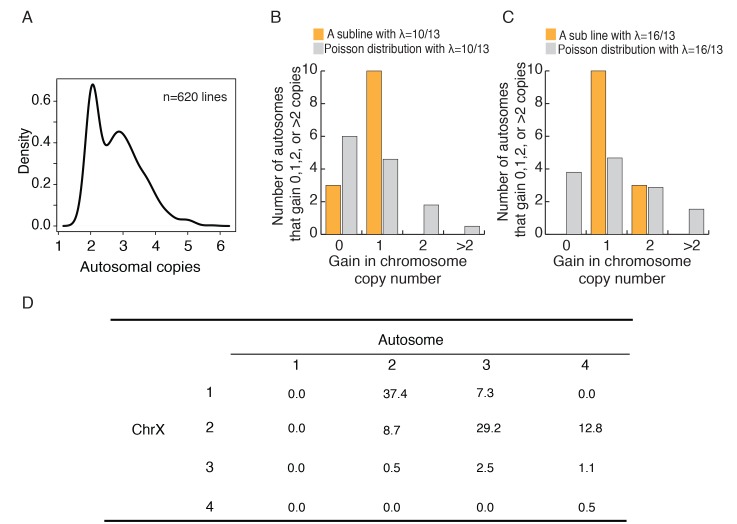
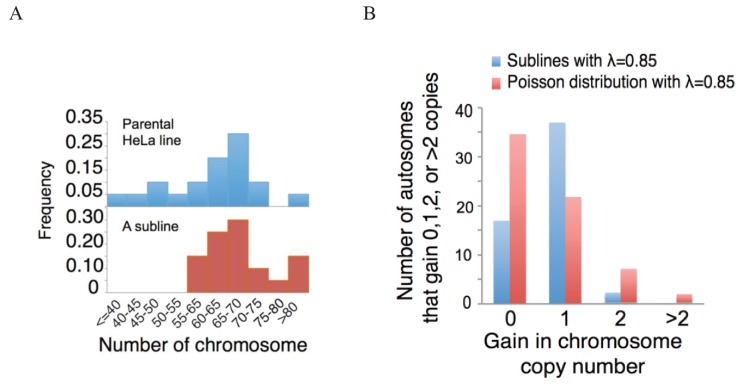
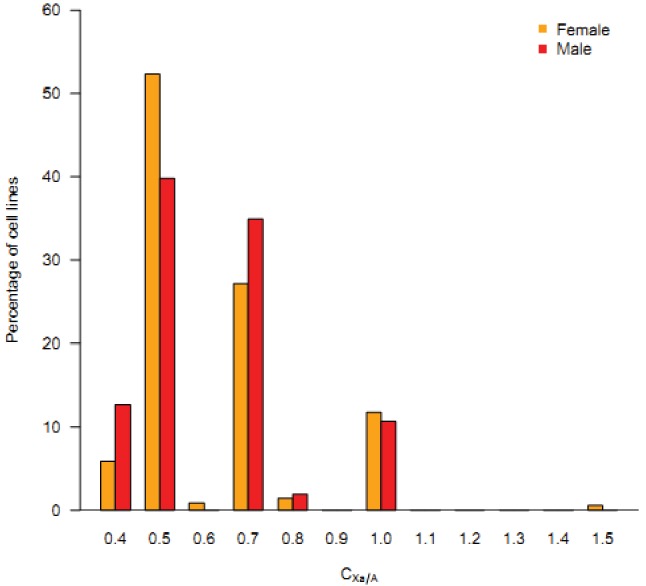
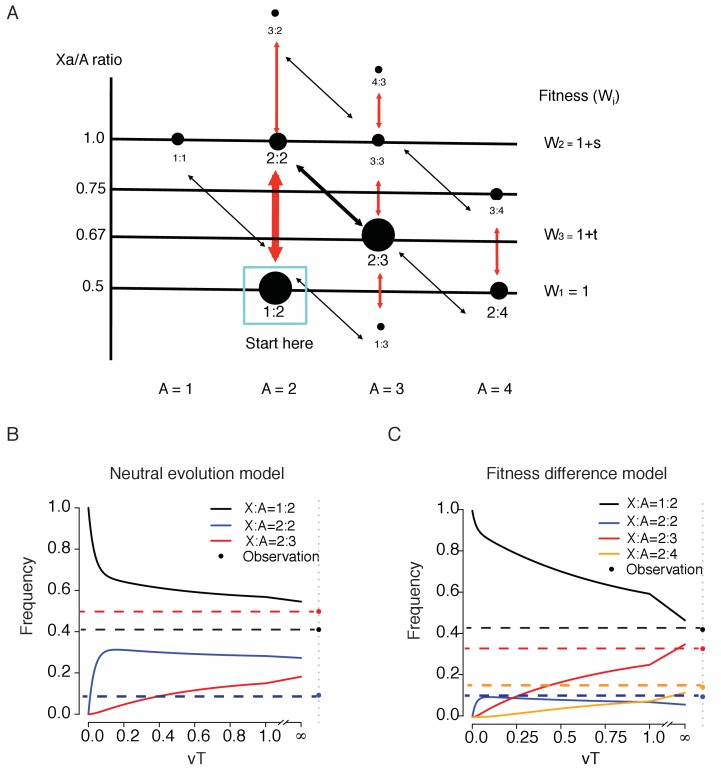
Cells of multi-cellular organisms evolve toward uni-cellularity in the form of cancer and, if humans intervene, continue to evolve in cell culture. During this process, gene dosage relationships may evolve in novel ways to cope with the new environment and may regress back to the ancestral uni-cellular state. In this context, the evolution of sex chromosomes vis-a-vis autosomes is of particular interest. Here, we report the chromosomal evolution in ~ 600 cancer cell lines. Many of them jettisoned either Y or the inactive X; thus, free-living male and female cells converge by becoming 'de-sexualized'. Surprisingly, the active X often doubled, accompanied by the addition of one haploid complement of autosomes, leading to an X:A ratio of 2:3 from the extant ratio of 1:2. Theoretical modeling of the frequency distribution of X:A karyotypes suggests that the 2:3 ratio confers a higher fitness and may reflect aspects of sex chromosome evolution.

Keywords: cancer cell line; dosage compensation; evolutionary biology; genomics; multi-cellularity; none; sex chromsome evolution; uni-cellularity.


Conflict of interest statement

No competing interests declared.

Figures

Figure 1.
Figure 1.. Convergence in sex chromosomes in culture human cells.
(A) Percentage of lines with LOH (loss of heterozygosity). Each black dot represents an autosome and the red dot represents X and Y. LOH in male and female lines are separately displayed on the X and Y-axes. (B) Percentage of cell lines with either one (n = 119, 34.80% of male cell lines) or two Xa’s (n = 108, 31.58% of male cell lines), cell lines with partial X’s are not included. (C) Expression level of XIST in male cell lines, [Y] means with or without Y chromosome. (D) Expression ratios of X-linked genes between Xa[Y] and XaXa[Y] cell lines. Each grey dot represents a gene, and significant differences are indicated by black dots (t-test, p<0.05). (E) Expression level of XIST in female cell lines with or without LOH. Female lines with LOH have very low levels of XIST, suggesting all X's being active. In non-LOH (XaXb) lines, the expression of XIST indicates the presence of inactive X’s. (F) Percentage of cell lines with either one (n = 30,10.79% of female cell lines) or two Xa’s (n = 31, 11% of female lines) in female lines with LOH of whole X chromosome. Non-LOH lines are not used because of the uncertainty in the number of Xa’s.
Figure 1—figure supplement 1.
Figure 1—figure supplement 1.. The frequency of chromosomes loss show negative correlation to their length.
There is a slight tendency for the smaller autosomes to have higher LOH's than for the larger ones (R =~ −0.4, p=~0.046). X chromosome shows significant deviated from the regression line.
Figure 2.
Figure 2.. X chromosomes in indivudial cells.
(A–B) Representative images of X chromosome FISH in the A549 cell line (A) with two Xs and HeLa (B) with three Xs. DNA is stained with DAPI (blue), and the X chromosome is labeled with Cy3 (red). (C–D) The distribution of the copy number of X’s among cells from A549 (n = 343) and HeLa (n = 170).
Figure 3.
Figure 3.. Increasing of expression ratio of X versus autosome (EX/A).
(A) EX/A distributions among normal (N) and cancer (C) cell lines. NF and NM (or CF and CM) designate normal (or cancer) female and male lines. EX/A in cancer cell lines become larger than those of the normal cell lines. Note that the expression in normal cell lines is narrowly distributed and is close to that of the normal tissue when compared. Although the numbers of NF and NM lines are much smaller than CF and CM lines (17 and 24 vs. 279 and 341), their EX/A distributions are much tighter than in cancer cell lines. The actual counts correspond to kernel density are given in Figure 3—figure supplement 2. (B) EX/A ratio in CF, CM, NF and NM lines with filtering with three different cutoffs (see Materials and methods). EX/A ratios are consistently higher in CF and CM lines than in NF and NM lines.
Figure 3—figure supplement 1.
Figure 3—figure supplement 1.. EX/A ratio in cancerous and normal cell lines by RNA-seq.
The gene expression information (gtf files) by RNA-seq was downloaded from UCSC (ftp://hgdownload.cse.ucsc.edu/goldenPath/hg19/encodeDCC/wgEncodeCshlLongRnaSeq/). There are 7 cancerous and 11 normal cell lines respectively. E X/A was calculated by the median value of expressed X-linked and autosomal genes. Expressed genes were selected as RPKM > 1.
Figure 3—figure supplement 2.
Figure 3—figure supplement 2.. The frequency spectrum of EX/A in male and female cancerous cell lines compared to normal male and female cell lines.
The median expression values of X and autosomes genes were used to compute EX/A for each cell lines. The proportion of cell lines within in a bin (0.1) was plotted as Y-axis. The EX/A of cancerous cell lines show a strong right shift compared to that of normal cell lines.
Figure 4.
Figure 4.. Autosomes change in a cohesive manner and coevolution of X and A.
(A) The density plot of autosome copy number among 620 cell lines shows peaks at 2 and 3 per autosome. (B-C) The observed distributions of gain in copy number among autosomes in two HeLa sublines. The expected Poisson distributions are also given for sublines with different means (λ = 10/13, 16/13; see text). (D) The percentages of C(Xa:A) types among the 620 cell lines.
Figure 4—figure supplement 1.
Figure 4—figure supplement 1.. Both the ancestral and sub-clonal HeLa population have 55–75 chromosomes centering around the triploid count of 69.
(B) The composite distribution of the five lines with λ < 1. And the comparison to Poisson distribution.
Figure 4—figure supplement 2.
Figure 4—figure supplement 2.. The frequency spectrum of C(Xa:A) across all male and female cancerous cell lines.
The median values for copy numbers on autosomes and X chromosome were used to calculate C(Xa:A). The proportion of cell lines within a bin (0.1) was plotted as the Y-axis. The discrete peaks denote the four major genotypes (X:3A; X:2A; 2X:3A; 2X:2A).
Figure 5.
Figure 5.. A model of karyotypic evolution driven by fitness differences.
(A) Evolutionary pathways of chromosomal changes. Each node represents a karyotype C(Xa:A) and the size roughly corresponds to its frequency. Cell fitness is assumed to be a function of the Xa/A ratio, which is represented by the Y-axis. The four abundant karyotypes are shown by solid black circles. Red arrows indicate faster changes in X and black arrows indicate slower changes in autosome. Main transitions between the common karyotypes are indicated by thicker arrows. (B) Changes in the frequencies of the three key genotypes as a function of time (T, expressed in units of 1/v) under fitness neutrality with all Wi’s = 1. The parameters for Equations 1 and 2 are u = 10 v, a = 2 and b = 1.5. Both the theoretical trajectories and the observed values are given. The C(2:3) cluster (x3) is far more common in the observation than in the neutral model. (C) Changes in 4 karyotypic frequencies under selection according to Equation S3 with s = −0,5 and t = 0.5. All other conditions are the same as above. Under selection, a reasonable agreement between the model and the observation can be obtained.

Comment in

  • Culture shock.
    Molaro A, Malik HS. Molaro A, et al. Elife. 2017 Dec 18;6:e33312. doi: 10.7554/eLife.33312. Elife. 2017. PMID: 29251593 Free PMC article.

References

    1. Alberts B, Johnson A, Lewis J, Raff M, Roberts K. Molecular Biology of the Cell. New York: Garland Science; 2002. Isolating Cells and Growing Them in Culture.
    1. Almendro V, Marusyk A, Polyak K. Cellular heterogeneity and molecular evolution in cancer. Annual Review of Pathology: Mechanisms of Disease. 2013;8:277–302. doi: 10.1146/annurev-pathol-020712-163923. - DOI - PubMed
    1. Barretina J, Caponigro G, Stransky N, Venkatesan K, Margolin AA, Kim S, Wilson CJ, Lehár J, Kryukov GV, Sonkin D, Reddy A, Liu M, Murray L, Berger MF, Monahan JE, Morais P, Meltzer J, Korejwa A, Jané-Valbuena J, Mapa FA, Thibault J, Bric-Furlong E, Raman P, Shipway A, Engels IH, Cheng J, Yu GK, Yu J, Aspesi P, de Silva M, Jagtap K, Jones MD, Wang L, Hatton C, Palescandolo E, Gupta S, Mahan S, Sougnez C, Onofrio RC, Liefeld T, MacConaill L, Winckler W, Reich M, Li N, Mesirov JP, Gabriel SB, Getz G, Ardlie K, Chan V, Myer VE, Weber BL, Porter J, Warmuth M, Finan P, Harris JL, Meyerson M, Golub TR, Morrissey MP, Sellers WR, Schlegel R, Garraway LA. The cancer cell line encyclopedia enables predictive modelling of anticancer drug sensitivity. Nature. 2012;483:603–607. doi: 10.1038/nature11003. - DOI - PMC - PubMed
    1. Boeva V, Popova T, Bleakley K, Chiche P, Cappo J, Schleiermacher G, Janoueix-Lerosey I, Delattre O, Barillot E. Control-FREEC: a tool for assessing copy number and allelic content using next-generation sequencing data. Bioinformatics. 2012;28:423–425. doi: 10.1093/bioinformatics/btr670. - DOI - PMC - PubMed
    1. Charlesworth B. The evolution of sex chromosomes. Science. 1991;251:1030–1033. doi: 10.1126/science.1998119. - DOI - PubMed

Publication types