. 2018 Feb 1;128(2):607-624.
doi: 10.1172/JCI95612. Epub 2017 Dec 18.

Erythrocyte efferocytosis modulates macrophages towards recovery after intracerebral hemorrhage

Affiliations

Erythrocyte efferocytosis modulates macrophages towards recovery after intracerebral hemorrhage

Che-Feng Chang et al. J Clin Invest. .

Abstract

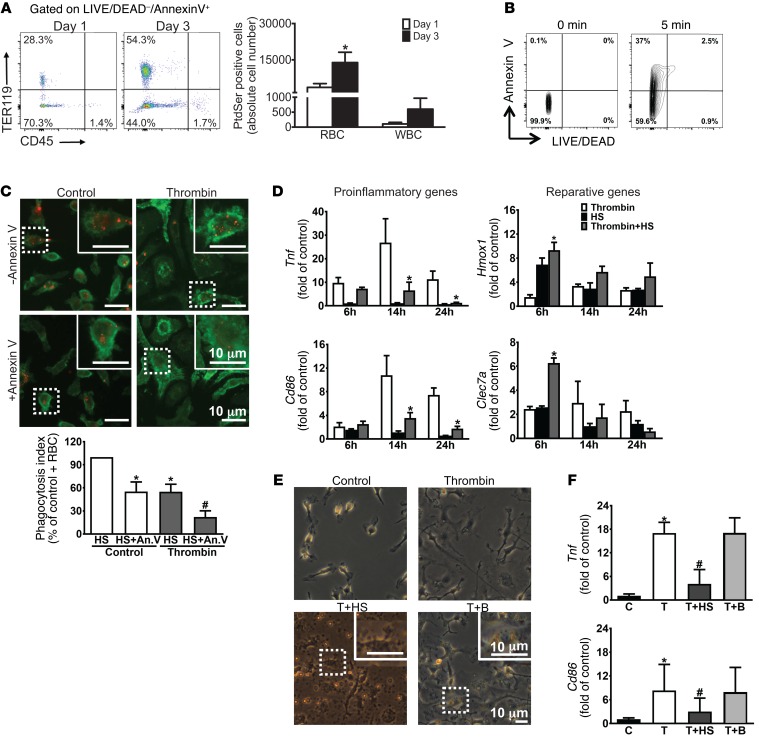
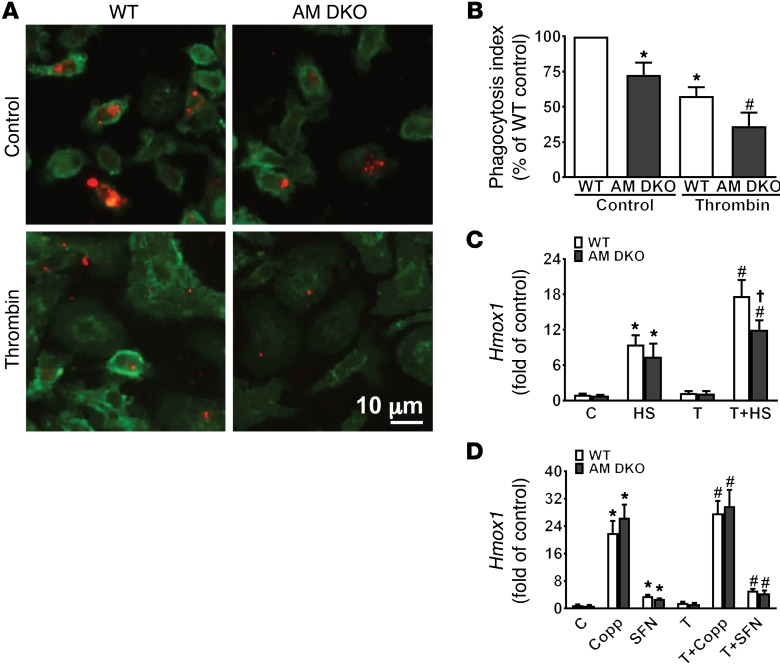
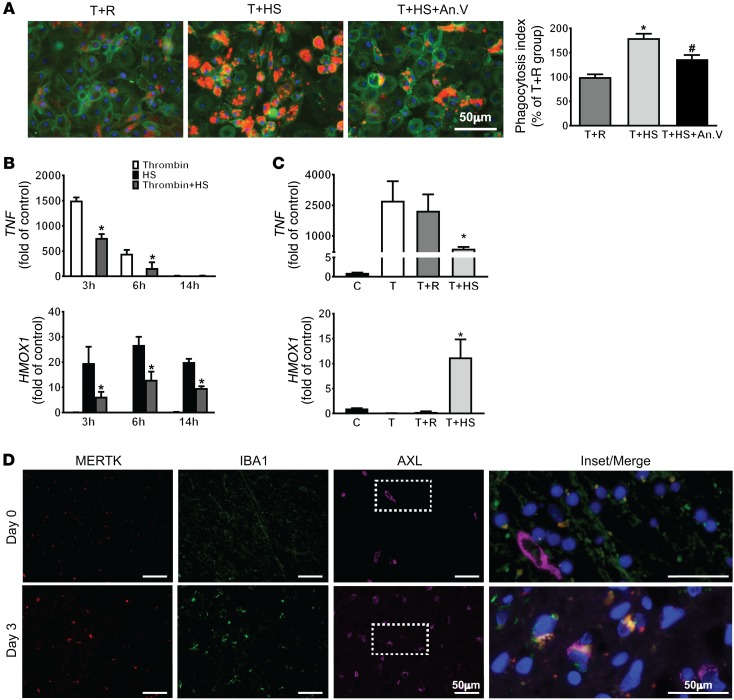
Macrophages are a source of both proinflammatory and restorative functions in damaged tissue through complex dynamic phenotypic changes. Here, we sought to determine whether monocyte-derived macrophages (MDMs) contribute to recovery after acute sterile brain injury. By profiling the transcriptional dynamics of MDMs in the murine brain after experimental intracerebral hemorrhage (ICH), we found robust phenotypic changes in the infiltrating MDMs over time and demonstrated that MDMs are essential for optimal hematoma clearance and neurological recovery. Next, we identified the mechanism by which the engulfment of erythrocytes with exposed phosphatidylserine directly modulated the phenotype of both murine and human MDMs. In mice, loss of receptor tyrosine kinases AXL and MERTK reduced efferocytosis of eryptotic erythrocytes and hematoma clearance, worsened neurological recovery, exacerbated iron deposition, and decreased alternative activation of macrophages after ICH. Patients with higher circulating soluble AXL had poor 1-year outcomes after ICH onset, suggesting that therapeutically augmenting efferocytosis may improve functional outcomes by both reducing tissue injury and promoting the development of reparative macrophage responses. Thus, our results identify the efferocytosis of eryptotic erythrocytes through AXL/MERTK as a critical mechanism modulating macrophage phenotype and contributing to recovery from ICH.

Keywords: Inflammation; Innate immunity; Macrophages; Neuroscience; Stroke.


Conflict of interest statement

Conflict of interest: The authors have declared that no conflict of interest exists.

Figures

Figure 1
Figure 1. MDMs contribute to hematoma clearance and functional recovery after ICH.
(A) Left: Representative brain coronal sections show hematoma from WT and Ccr2–/– bone marrow chimeras (BMCs) at days 7 and 15 after ICH. Right: Quantification of residual hematoma volume in the WT and Ccr2–/– BMCs. n = 11 at day 7; n = 9 at day 15. *P < 0.05 by Student’s t test. (B) Cylinder test and apomorphine turning test from WT and Ccr2–/– BMCs at day 15 after ICH. n = 6/group for cylinder test; n = 8/group for apomorphine turning test. *P < 0.05 by Student’s t test. (C) Cylinder test, neurological deficit score, and corner test in control- and anti-CCR2 antibody–treated mice at days 1 and 3 after collagenase ICH. n = 7/group. *P < 0.05 by 1-way repeated-measures ANOVA and Bonferroni’s post hoc test. (D) Top: Representative coronal sections show hematoma from control- and anti-CCR2 antibody–treated WT mice after blood injection ICH at 7 days. Bottom: Quantification of hematoma volume, n = 3/ group. *P < 0.05 versus control by Student’s t test. (E) Top: Representative coronal sections show hematoma in the isotype control– and anti-CCR2 antibody–treated mice from collagenase model at day 12. Bottom: Quantification of hematoma volume. n = 8/group. *P < 0.05 versus control by Student’s t test. (F) The cylinder test, neurological deficit score, and corner test in isotype control– and anti-CCR2 antibody–treated ICH mice at days 3, 5, 7, 9, and 11 after collagenase ICH surgery. n = 8/group. *P < 0.05 versus isotype control group by 1-way repeated-measures ANOVA and Bonferroni’s post hoc test. αCCR2, anti-CCR2 antibody.
Figure 2
Figure 2. Temporal transcriptional analysis of MDMs identifies Axl and Mertk as potential mediators of the resolution phase after ICH.
(A) The scatter plots show each sample projected on the first 2 principal components and are color coded according to time point after ICH. Biological replicates cluster closely at each time point. (B) Heatmap of the Z score of genes identified by PCA for each sample. Data were clustered hierarchically in GENE-E using one minus the Pearson correlation and complete linkage. Data are colored according to row minimum and maximum. (C) Top: Volcano plot showing differentially expressed genes in MDMs from brain on day 1 compared with day 3 after ICH. Axl is indicated in purple. Bottom: Volcano plot showing differentially expressed genes in MDMs from brain on day 1 compared with day 7 after ICH. Axl has the highest fold increase in MDMs on day 7. (D) Top: Representative histograms show AXL and MERTK expression on MDMs in FMO (gray) and post-ICH day 1 (red), 3 (blue), and 7 (green) samples. Bottom, quantification of percentage of AXL and MERTK expression on MDMs. n = 6/ group. *P < 0.05 versus FMO, day 1, or day 3 group by 1-way repeated-measures ANOVA and Bonferroni’s post hoc test. Data are the mean ± SD. FMO, fluorescence-minus-one control; MFI, mean fluorescence intensity.
Figure 3
Figure 3. Engulfment of eryptotic erythrocytes induces macrophage reparative phenotype.
(A) Left: Representative flow cytometry plots of TER119 and CD45 expression from brains at days 1 and 3 after ICH. Population TER119+CD45 and TER119CD45+ quadrants representing eryptotic erythrocytes and apoptotic leukocytes, respectively, and their percentages are shown. Right: Quantification of absolute number of PtdSer-positive RBCs and WBCs in the brains at days 1 and 3 after ICH. n = 3/group. *P < 0.05 versus day 1 group by Student’s t test. (B) Representative flow cytometry shows LIVE/DEADannexin V+ population from non–heat-shocked erythrocytes (0 minutes) and 56°C heat-shocked (HS) erythrocytes (5 minutes), and their percentages are shown. n = 3/group. (C) Top: Representative immunofluorescence images show engulfment of PHK-26–labeled HS erythrocytes (red) in normal and thrombin-stimulated CD11b-positive (green) BMDMs with or without annexin V incubation, with higher magnification of the boxed area in the inset. Bottom: Quantification of n = 3/group; each independent experiment includes 2 technical replicates. *P < 0.05 versus control+HS group; #P < 0.05 versus thrombin+HS group by Student’s t test. (D) Gene expression for markers of proinflammatory (Tnf and Cd86) and reparative (Hmox1 and Clec7a) phenotypes from BMDMs with or without HS treatment under normal or thrombin-stimulated conditions. n = 3/group. *P < 0.05 versus thrombin group by 1-way ANOVA and Bonferroni’s post hoc test. (E) Representative phase contrast images showing control and thrombin-stimulated BMDMs treated with HS and beads, with inset of higher magnification of the boxed area showing engulfment. n = 3/group. (F) Gene expression of Tnf and Cd86 in thrombin-stimulated BMDMs is reduced after HS but not bead treatment. n = 3/group. *P < 0.05 versus control group; #P < 0.05 versus thrombin group by Student’s t test. An.V, annexin V; B, beads; C, control; T, thrombin.
Figure 4
Figure 4. Axl/Mertk deficiency reduces erythrophagocytosis and macrophage reparative phenotype.
(A) Representative immunofluorescence images show engulfment of heat-shocked (HS) PHK-26–labeled erythrocytes (red) in CD11b-positive (green) WT and Axl–/– Mertk–/– double-knockout (AM DKO) BMDMs with or without thrombin stimulation. (B) Bar graph shows reduced erythrophagocytosis in AM DKO BMDMs compared with WT with or without thrombin stimulation. n = 3/group; each independent experiment includes 2 technical replicates. *P < 0.05 versus WT control; #P < 0.05 WT thrombin-stimulated by Student’s t test. (C) Hmox1 expression from WT and AM DKO BMDMs after 6-hour HS, thrombin, or thrombin+HS stimulation. n= 4/group. *P < 0.05 versus control; #P < 0.05 versus thrombin; P < 0.05 versus WT by Student’s t test. (D) Hmox1 expression from WT and AM DKO BMDMs after 6-hour cobalt protoporphyrin (Copp) or sulforaphane (SFN) treatment with or without thrombin stimulation. n = 4 /group. *P < 0.05 versus control; #P < 0.05 versus thrombin by Student’s t test. Throughout, data are the mean ± SD. B, beads; C, control; T, thrombin.
Figure 5
Figure 5. Axl/Mertk deficiency impedes ICH brain recovery and reduces macrophage reparative phenotype.
(A) Left: Representative T2-weighted MR images and R2 maps delineating hematoma in the WT and Axl–/– Mertk–/– double-knockout (AM DKO) brains on day 7 after ICH show increased hemorrhage volume in the AM DKO mice. The hemorrhage in gray matter is shown in red and in white matter is shown in yellow. Total hematoma volume quantified in right panel, n =10/group. *P < 0.05 versus WT group by Student’s t test. (B) Representative Perls’ staining image shows iron deposition from WT and AM DKO coronal brain sections at day 7 after ICH. Dotted lines mark the needle track. (C) Cylinder test results from WT and AM DKO mice at days 1, 3, and 7 after ICH. n = 11 for WT and n = 10 for AM DKO. *P < 0.05 versus WT group by 1-way repeated-measures ANOVA and Bonferroni’s post hoc test. (D) Left: Representative histogram shows PKH-26–labeled RBC signal in monocyte-derived macrophages (MDMs) from control and WT and AM DKO ICH chimeras at day 3 after ICH. Right: Quantification of percentage of PKH-26–labeled RBC expression in MDMs. n = 3/group. *P < 0.05 versus WT chimeras by Student’s t test. (E) Left: Representative histograms show heme oxygenase-1 (HO-1), CD36, and TNF expression in the MDMs from brains of WT and AM DKO chimeras on day 7 after ICH, with quantifications in the right panels. n = 14 for WT chimeras and n = 15 for AM DKO chimeras. *P < 0.05 versus WT chimeras by Student’s t test. (F) Cylinder test in WT and AM DKO chimeras at days 1, 3, and 7 after ICH. n = 14 for WT chimeras and n = 15 for AM DKO chimeras. *P < 0.05 versus WT chimeras group by 1-way repeated-measures ANOVA and Bonferroni’s post hoc test. NS, no significant difference.
Figure 6
Figure 6. Efferocytosis modulates human MDM phenotype and is associated with ICH recovery in patients.
(A) Left: Representative immunofluorescence images show engulfment of PHK-26–labeled control erythrocytes (R) and heat-shocked erythrocytes (HS) (red) in thrombin-stimulated CD11b-positive (green) MDMs with or without annexin V incubation. Right: Quantification of erythrophagocytosis. n = 3/group; each independent experiment includes 3 technical replicates. *P < 0.05 versus thrombin+R; #P < 0.05 versus thrombin+HS by 1-way ANOVA and Bonferroni’s post hoc test. (B) Gene expression of TNF and HMOX1 in human macrophages after thrombin, HS, and thrombin+HS stimulation for 3, 6, and 14 hours. n = 3/group. *P < 0.05 versus HS group by 1-way ANOVA and Bonferroni’s post hoc test. (C) TNF and HMOX1 gene expression in human macrophages after thrombin, thrombin+R, and thrombin+HS treatment for 3 hours (TNF) and 6 hours (HMOX1). n = 3/ group. *P < 0.05 versus thrombin group by Student’s t test. (D) Representative immunofluorescence images show MERTK (red), IBA1 (green), and AXL (pink) signals in the day 0 and day 3 ICH patient brain sections, with enlarged and merged image of the boxed area shown for colocalization. An.V, annexin V; C, control; T, thrombin.

References

    1. Guilliams M, et al. Dendritic cells, monocytes and macrophages: a unified nomenclature based on ontogeny. Nat Rev Immunol. 2014;14(8):571–578. doi: 10.1038/nri3712. - DOI - PMC - PubMed
    1. Varol C, Mildner A, Jung S. Macrophages: development and tissue specialization. Annu Rev Immunol. 2015;33:643–675. doi: 10.1146/annurev-immunol-032414-112220. - DOI - PubMed
    1. Mosser DM, Edwards JP. Exploring the full spectrum of macrophage activation. Nat Rev Immunol. 2008;8(12):958–969. doi: 10.1038/nri2448. - DOI - PMC - PubMed
    1. Murray PJ, et al. Macrophage activation and polarization: nomenclature and experimental guidelines. Immunity. 2014;41(1):14–20. doi: 10.1016/j.immuni.2014.06.008. - DOI - PMC - PubMed
    1. Liddiard K, Taylor PR. Understanding local macrophage phenotypes in disease: shape-shifting macrophages. Nat Med. 2015;21(2):119–120. doi: 10.1038/nm.3798. - DOI - PubMed

Publication types

MeSH terms

Substances