. 2018 Feb;36(2):179-189.
doi: 10.1038/nbt.4048. Epub 2017 Dec 18.

Orthologous CRISPR-Cas9 enzymes for combinatorial genetic screens

Affiliations

Orthologous CRISPR-Cas9 enzymes for combinatorial genetic screens

Fadi J Najm et al. Nat Biotechnol. 2018 Feb.

Abstract

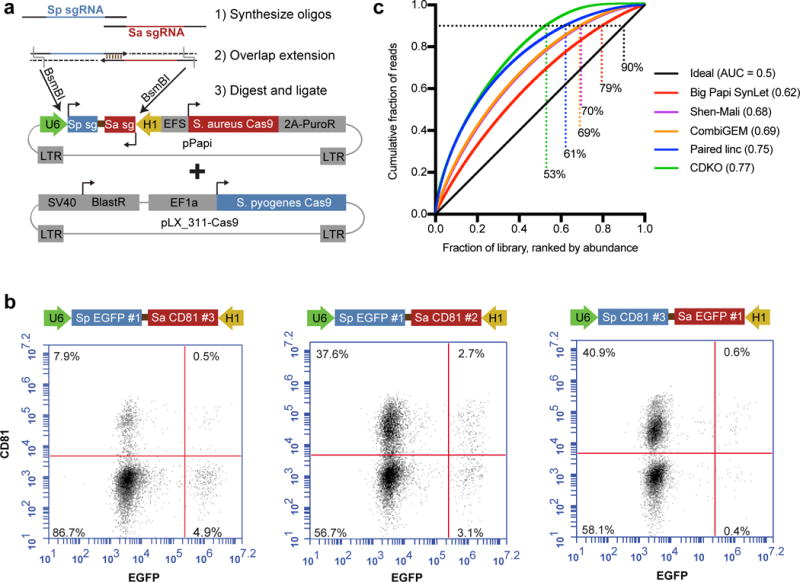
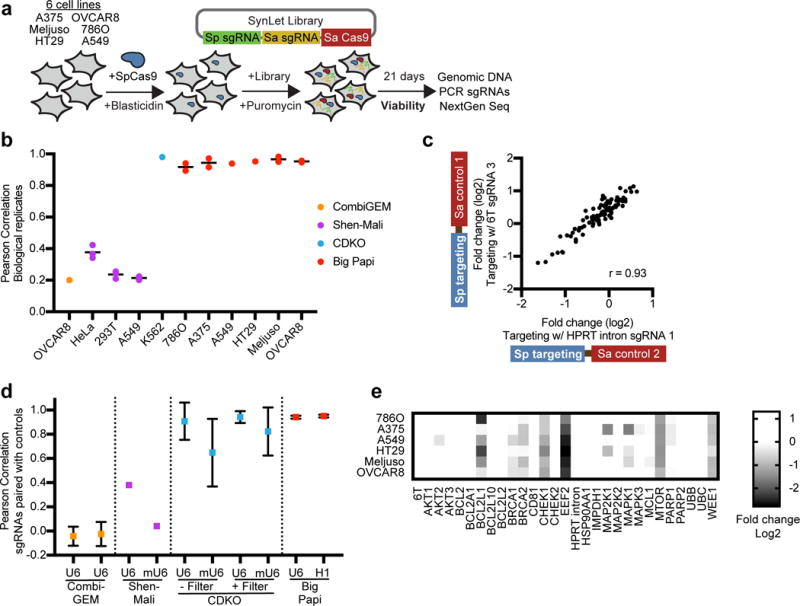
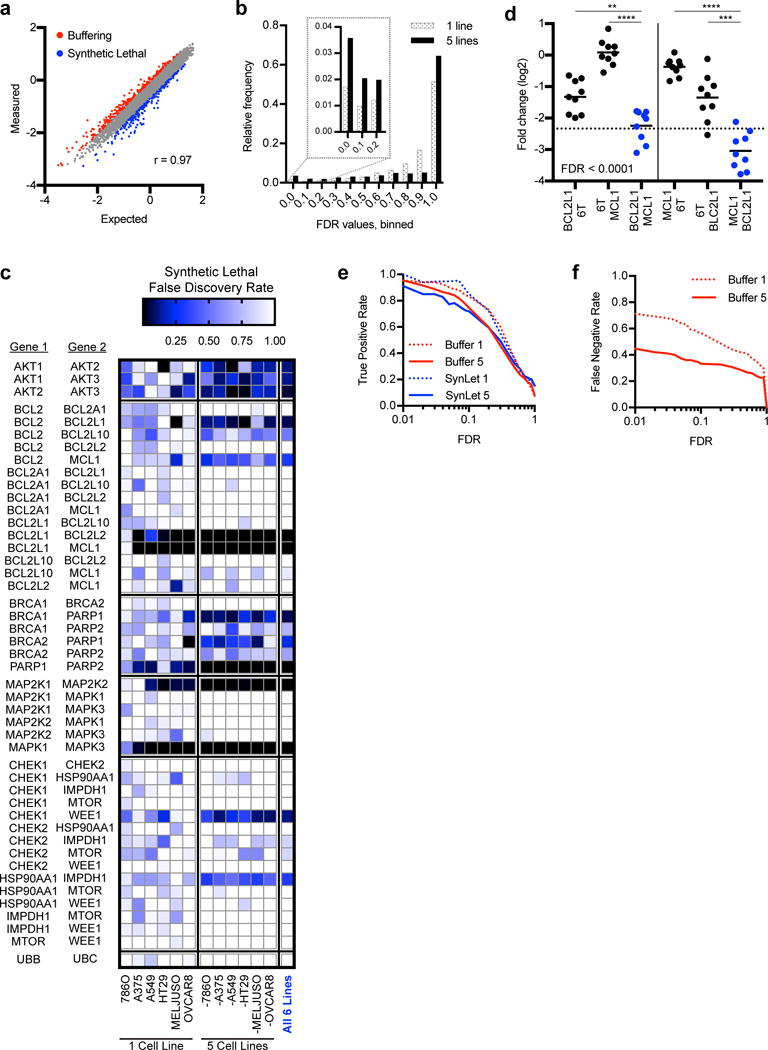
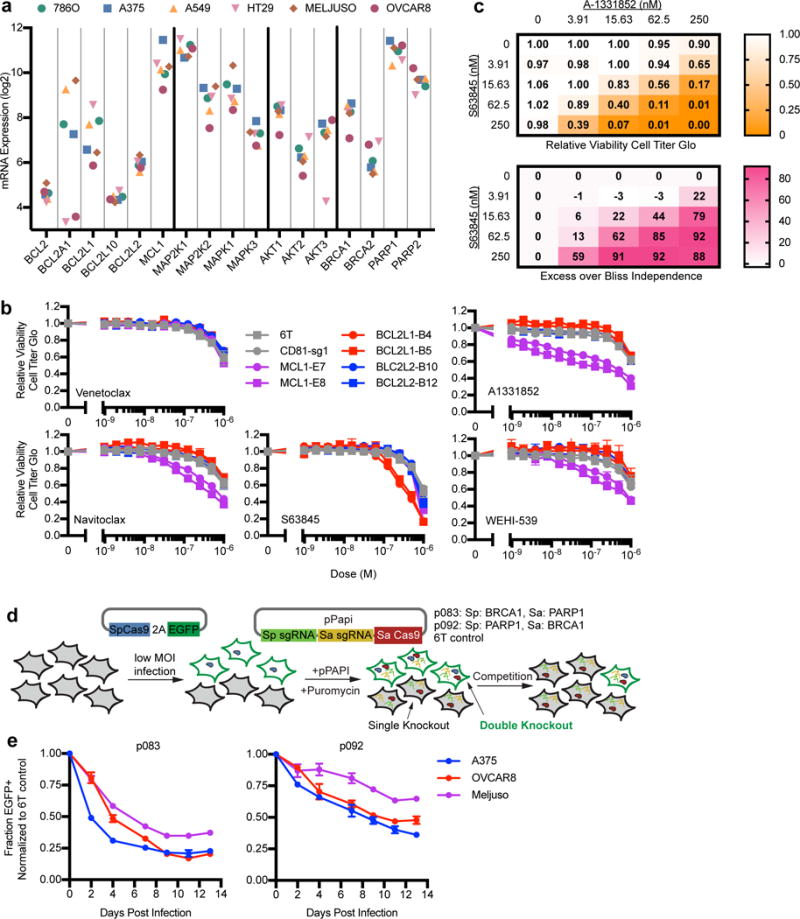
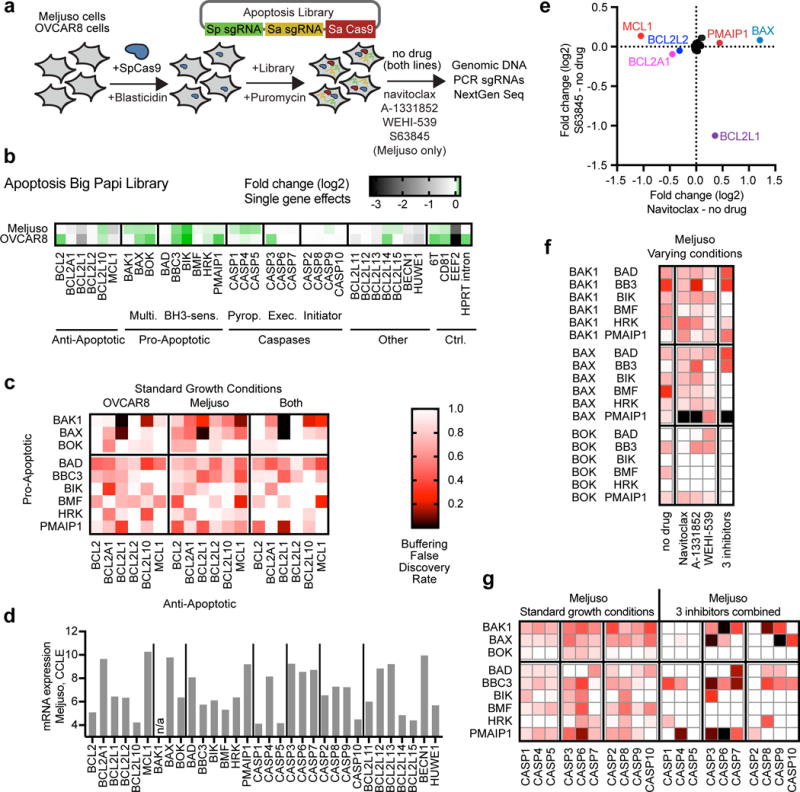
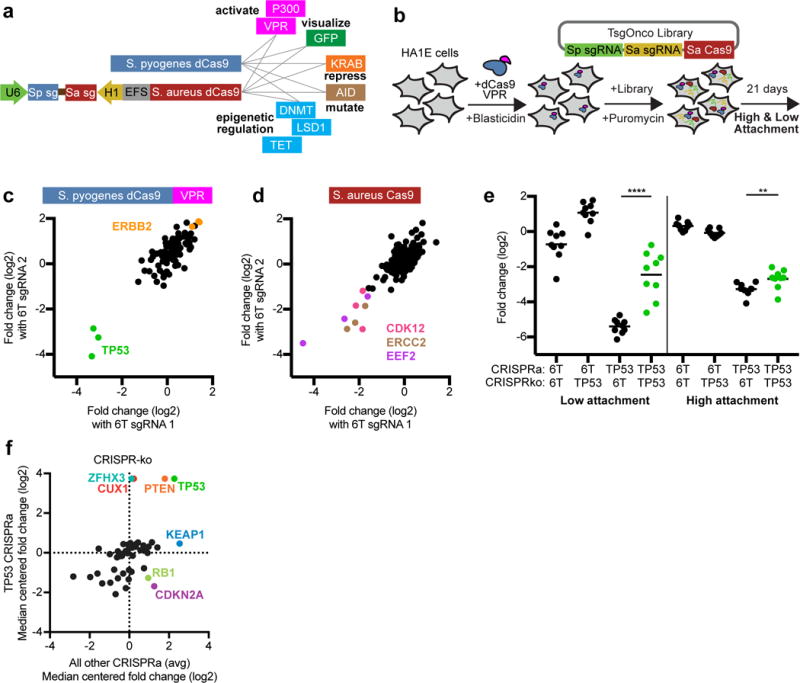
Combinatorial genetic screening using CRISPR-Cas9 is a useful approach to uncover redundant genes and to explore complex gene networks. However, current methods suffer from interference between the single-guide RNAs (sgRNAs) and from limited gene targeting activity. To increase the efficiency of combinatorial screening, we employ orthogonal Cas9 enzymes from Staphylococcus aureus and Streptococcus pyogenes. We used machine learning to establish S. aureus Cas9 sgRNA design rules and paired S. aureus Cas9 with S. pyogenes Cas9 to achieve dual targeting in a high fraction of cells. We also developed a lentiviral vector and cloning strategy to generate high-complexity pooled dual-knockout libraries to identify synthetic lethal and buffering gene pairs across multiple cell types, including MAPK pathway genes and apoptotic genes. Our orthologous approach also enabled a screen combining gene knockouts with transcriptional activation, which revealed genetic interactions with TP53. The "Big Papi" (paired aureus and pyogenes for interactions) approach described here will be widely applicable for the study of combinatorial phenotypes.


Conflict of interest statement

COMPETING FINANCIAL INTERESTS

J.L. and N.F. are employed by Microsoft Research. J.G.D. consults for Tango Therapeutics.

Figures

Figure 1
Figure 1
Development of a two Cas9 system for combinatorial screening. (a) Schematic of the dual sgRNA expressing lentiviral vector used in this study, pPapi, as well as the cloning scheme. Pools of oligos are annealed, extended, and ligated into the pPapi vector, and used in cells that already carry the pLX_311 vector expressing SpCas9. (b) Flow cytometry plots indicating double knockout efficiency with percentage of cells indicated in each quadrant. (c) Area-Under-the-Curve (AUC) analysis of library representation. Representation was evaluated for the pDNA library for the Big Papi and CDKO libraries. Plasmid DNA sequencing was not provided for CombiGEM or Shen-Mali libraries, so early time points of genomic DNA were used, which typically very tightly match distributions of pDNA for sgRNA libraries. A perfectly distributed library (ideal) is shown in black. Big Papi SynLet library: sequencing of plasmid DNA (pDNA); Shen-Mali: day 3 genomic DNA from HeLa cells; CombiGEM: day 5 genomic DNA; CDKO: pDNA; Paired linc: pDNA. Percentages indicate each library’s representation at 90% cumulative reads, and AUC values are noted in the key.
Figure 2
Figure 2
Development of SaCas9 on-target rules. (a) Performance of tiled libraries of all possible sgRNAs targeting the essential EEF2 gene, grouped by PAM sequence. The box represents the 25th, 50th and 75th percentiles, whiskers show 10th and 90th percentiles. (b) Comparison of the activity of EEF2 sgRNAs targeting the same cut site using either SaCas9 (NNGRRT PAM) or SpCas9 (NGG PAM). (c) Spearman correlations of the activity of sgRNAs targeting essential genes across cell lines. (d) Single nucleotide features predictive of SaCas9 activity. Top 20% of sgRNA sequences were treated as highly active and a 20% versus 80% classification model was used to identify predictive features. The –log 10 p-values are plotted (two-sided Fisher’s exact test). (e) Contribution of different groups of features to the gradient boosted regression tree model for SaCas9 activity. (f) Example performance of the model. Using a version of the model in which EEF2 sgRNAs were not used in the training, sgRNA activity score is plotted versus the measured value. (g) For the model version used in (f), the fraction of sgRNAs that led to at least 4-fold depletion, binned by predicted score. The number of sgRNAs in each bin is shown above the bar. (h) Increase in model performance as more genes are used in the training set, using Spearman correlation to compare the predicted activity score to the measured value. Error bars represent standard deviation across random draws of the training genes and the held-out test gene.
Figure 3
Figure 3
Evaluation of synthetic lethal screens. (a) Schematic of the Big Papi screens performed with the SynLet library. (b) Comparison of log2-fold-change for sgRNA pairs across biological replicates and cell lines for the Big Papi approach and other published screens. When multiple time points were assessed, each is shown as a point and the line segment represents the mean. CombiGEM: Day 20 compared to Day 15; Shen-Mali: Day 14, Day 21, and Day 28 compared to Day 3; CDKO: Day 14 compared to pDNA, drug library; Big Papi: Day 9, 11, or 21 compared to pDNA. (c) Example comparison of the activity of targeting sgRNAs in the U6 position when paired with different control sgRNAs in the H1 position for the Big Papi screening approach. This data demonstrates the correlation among subsets of distinct library constructs that all target the same genomic site. (d) Pearson correlations for all pairwise combinations of controls, as in panel (c), for both sgRNA positions for several screening approaches. The point indicates the mean, the error bars represent one standard deviation for the range of pairwise correlation values. The promoter expressing the targeting sgRNA labels the x-axis. CombiGEM (n = 3 pairwise comparisons): sgRNAs paired with 3 ‘dummy’ controls. Shen-Mali (n = 1): sgRNAs paired with the non-targeting sgRNAs #362 and #412 in the HeLa data. CDKO (n = 3,081): sgRNAs paired with 79 ‘safe’ sgRNAs. Big Papi (n = 28): sgRNAs paired with ‘6T’ and ‘HPRT intron’ controls in the Meljuso, day 21 data. (e) Assessment of the essentiality of individual genes with the Big Papi screening approach at day 21. The log2-fold-change for all six targeting sgRNAs, three with SaCas9 and three with SpCas9, were averaged to produce a gene-level score.
Figure 4
Figure 4
Synthetic lethal Big Papi screen. (a) Correlation between measured and expected log2-fold-change values for combinatorial targeting. Data points above (red) and below (blue) 2 standard deviations are highlighted, representing buffering and synthetic lethal interactions, respectively. Data from Meljuso cells are plotted as a representative cell line. (b) Distribution of all false discovery rates determined for buffering and synthetic lethal interactions using either data from individual cell lines (1 line) or combining data from 5 lines. When 5 lines are combined, more pairs score with either low FDRs or with an FDR = 1. (c) FDRs for synthetic lethal interactions for gene pairs within pre-defined groups at the day 21 time point. Results are shown from individual cell lines, all leave-one-out combinations, and the combination of all 6 lines. (d) Primary screening data showing the performance of sgRNAs for BCL2L1 and MCL1 when paired together or with 6T controls in Meljuso cells at day 21. Average is denoted with a line whereas each dot represents an sgRNA combination. Dotted line refers to 2 standard deviations (2SD) from the mean for individual sgRNAs paired with controls (black dots). P-values for depletion of the dual-targeting sets of sgRNA pairs are based on the Mann-Whitney test, **P<0.01; ***P<0.001; ****P<0.0001. (e) Comparisons of the estimated true positive rate to the calculated FDR for synthetic lethal and buffering interactions, using either individual cell lines or all leave-one-out combinations of 5 cell lines. (f) Estimation of the false negative rate based on analysis of same-gene buffering interactions, using either individual cell lines or all leave-one-out combinations of 5 cell lines, plotted against the FDR.
Figure 5
Figure 5
Validation of synthetic lethal interactions. (a) Gene expression values from the Cancer Cell Line Encyclopedia. (b) Validation of genetic interactions with individual gene knockout combined with small molecules. Seven days after transduction with lentivirus expressing individual sgRNAs, cells were incubated with small molecules for three days before assaying viability by Cell Titer Glo. Points represent the average and whiskers represent the maximum and minimum of two replicate wells. (c) Validation of BCL2L1 – MCL1 genetic interaction with combinations of small molecules. Cells were incubated with small molecules for three days before assaying viability by Cell Titer Glo (top). Bliss independence scores were then calculated (bottom). (d) Schematic of a competition experiment used to compare cell viability of single versus double knockout of BRCA1 and PARP1. EGFP is co-delivered with SpCas9 at a low MOI, followed by introduction of the pPapi vector, which contained SaCas9 and two sgRNAs targeting BRCA1 and PARP1 with SpCas9 and SaCas9, respectively (p083), or the reverse (p092). EGFP is thus a marker for SpCas9 delivery; EGFP+ cells are double knockouts while EGFP- cells only have knockout of the SaCas9-targeted gene. Controls, containing 6T in place of the sgRNA, were also included. (e) Fraction of EGFP+ cells over time for cells receiving the indicated vector, normalized to the population that received the 6T control construct. The pPapi vectors were infected in triplicate, and error bars represent the standard deviation of the three measurements.
Figure 6
Figure 6
Apoptosis Big Papi screen. (a) Schematic of the screen design. (b) Genes targeted by the Apoptosis library and the viability effects caused by single gene knockout; fold change values are calculated relative to the pDNA pool for targeting sgRNAs paired with the 6T and HPRT intron controls. (c) FDRs for buffering interactions detected between pro- and anti-apoptotic genes in Meljuso and OVCAR8 cells as well as the combined data from both cell lines. (d) From the Cancer Cell Line Encyclopedia, expression levels of these genes in Meljuso cells. BAK1 was not assessed in the CCLE, indicated by an asterisk. (e) In Meljuso cells with single gene knockouts, comparison of resistance and sensitization phenotypes for two small molecules. The fold change values are calculated relative to the no drug arm for targeting sgRNAs paired with the 6T and HPRT intron controls. Genes of interest are colored and labeled. (f) Buffering interactions in Meljuso cells for combinations of multidomain apoptotic genes with BH3-only sensitizer genes in different growth conditions. Data from the three small molecules were combined for the final column. Heat map scale is the same as in panel c. (g) Buffering interactions in Meljuso cells for combinations of pro-apoptotic genes and caspase genes in standard growth conditions and the combined data from the three small molecules. Heat map scale is the same as in panel c.
Figure 7
Figure 7
Big Papi screen with two Cas9 activities. (a) In addition to using either or both Cas9s as DNA endonucleases to inactivate genes, nuclease dead versions of Cas9 (dCas9) can be used with appended domains to manipulate DNA with multiple activities. (b) Schematic of the screen for the TsgOnco Big Papi library. (c) For the TsgOnco library in high attachment conditions in HA1E cells, comparison of the activity of CRISPRa sgRNAs when paired with control SaCas9 sgRNAs. (d) Comparison of the activity of CRISPR-knockout sgRNAs when paired with control dSpCas9-VPR sgRNAs in high attachment conditions. (e) Buffering interaction observed in HA1E cells, where knockout of TP53 protects the cells from loss of viability caused by overexpression of TP53. Data for both low and high attachment conditions are shown. P-values for depletion of the dual-targeting sets of sgRNA pairs are based on the Mann-Whitney test; significance labels: **P<0.01; ****P<0.0001. (f) Knockout of tumor suppressor genes, comparing viability upon TP53 overexpression to the average viability of all other CRISPRa target genes. Genes of interest are labeled and colored.

Comment in

References

    1. Roguev A, et al. Quantitative genetic-interaction mapping in mammalian cells. Nature Methods. 2013;10:432–437. - PMC - PubMed
    1. Horn T, et al. Mapping of signaling networks through synthetic genetic interaction analysis by RNAi. Nature Methods. 2011;8:341–346. - PubMed
    1. Tong AHY, et al. Global mapping of the yeast genetic interaction network. Science. 2004;303:808–813. - PubMed
    1. Costanzo M, et al. A global genetic interaction network maps a wiring diagram of cellular function. Science. 2016;353:aaf1420–aaf1420. - PMC - PubMed
    1. Bassik MC, et al. A systematic mammalian genetic interaction map reveals pathways underlying ricin susceptibility. Cell. 2013;152:909–922. - PMC - PubMed

METHODS-ONLY REFERENCES

    1. Lawrence MS, et al. Discovery and saturation analysis of cancer genes across 21 tumour types. Nature. 2014;505:495–501. - PMC - PubMed
    1. Forbes SA, et al. COSMIC: somatic cancer genetics at high-resolution. Nucleic Acids Research. 2017;45:D777–D783. - PMC - PubMed

Publication types

MeSH terms

Substances