. 2018 Oct;68(4):1331-1346.
doi: 10.1002/hep.29742. Epub 2018 May 21.

Lipotoxicity induces hepatic protein inclusions through TANK binding kinase 1-mediated p62/sequestosome 1 phosphorylation

Affiliations

Lipotoxicity induces hepatic protein inclusions through TANK binding kinase 1-mediated p62/sequestosome 1 phosphorylation

Chun-Seok Cho et al. Hepatology. 2018 Oct.

Abstract

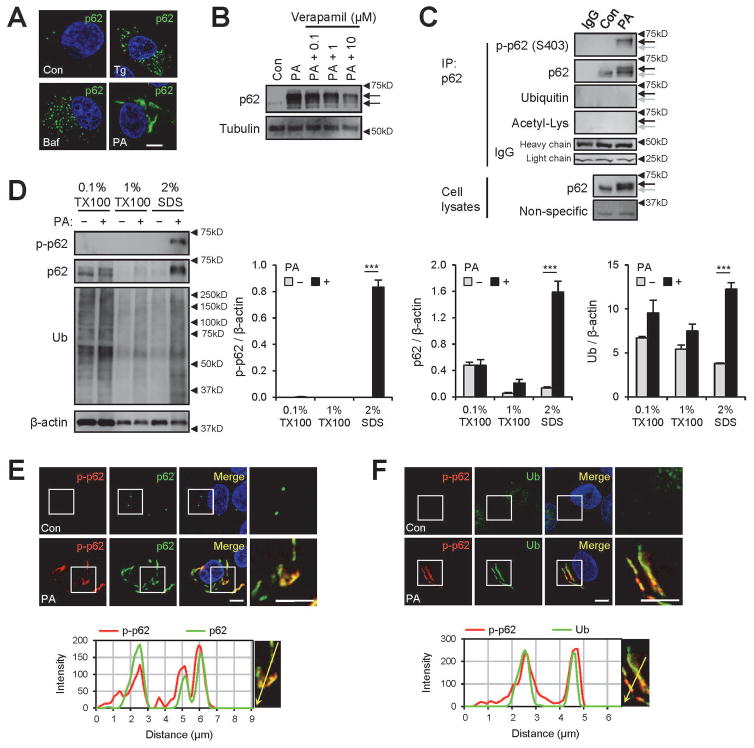
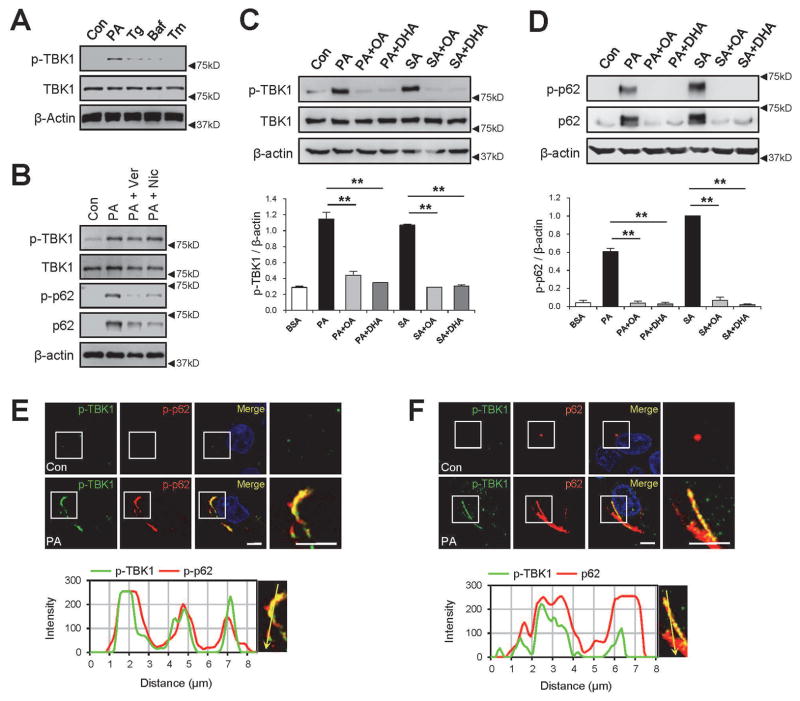
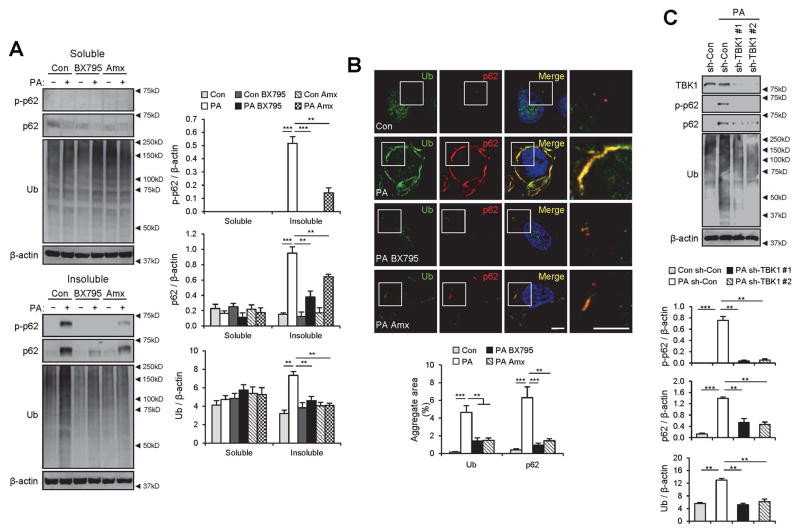
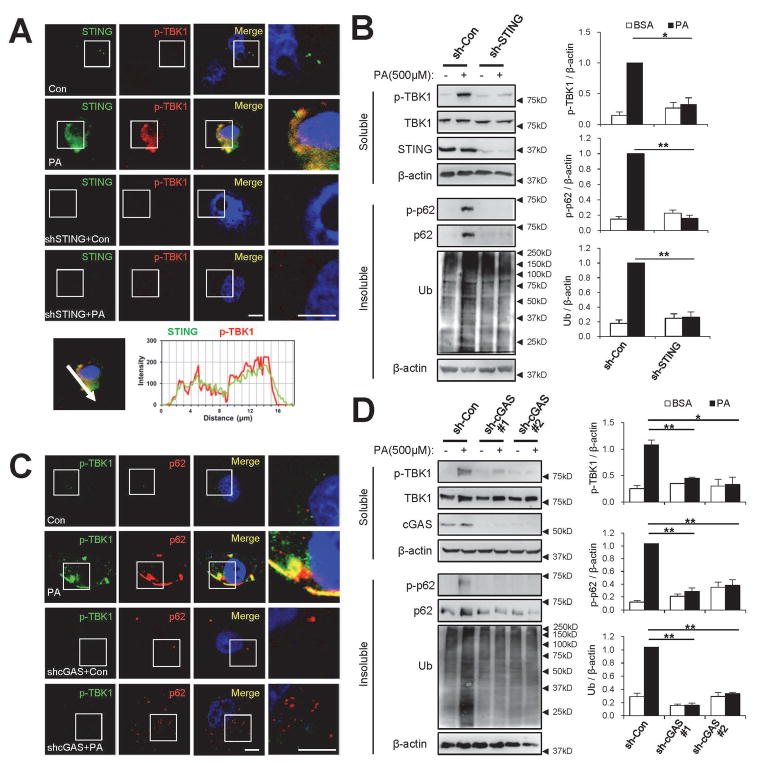
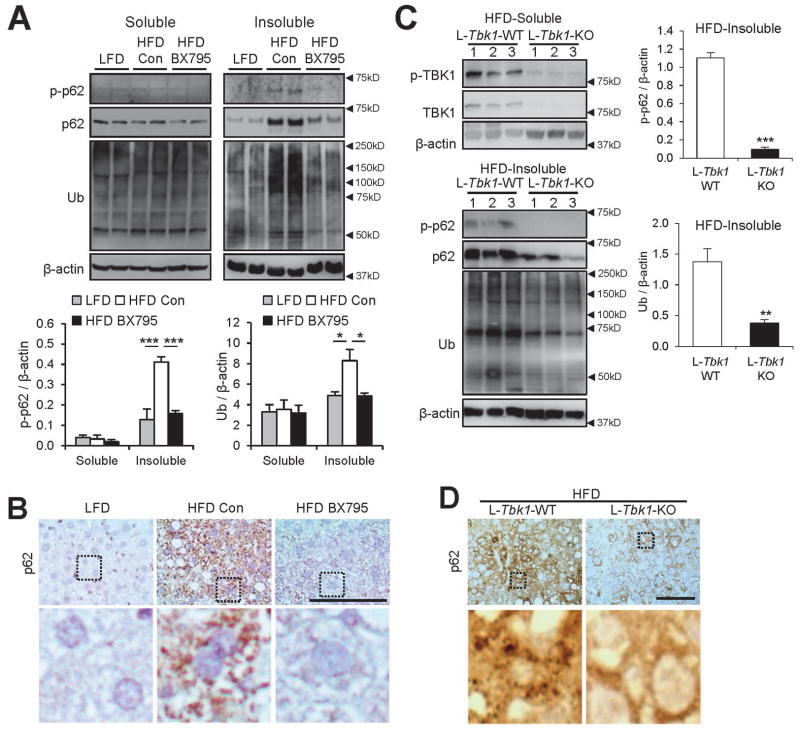
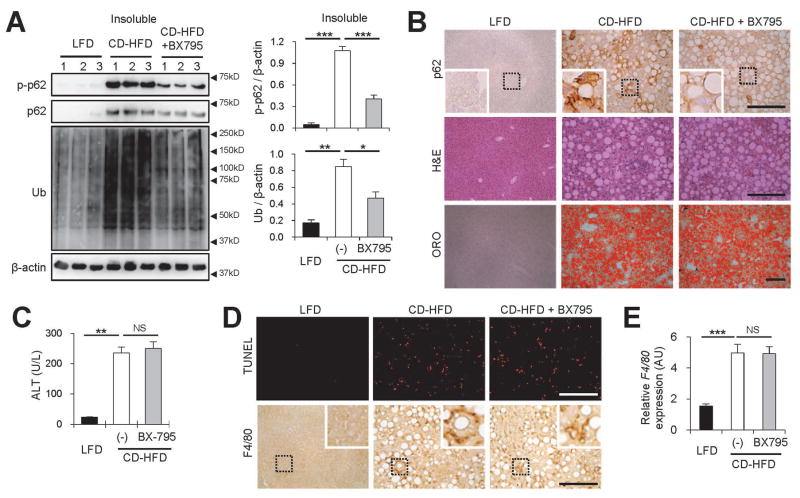
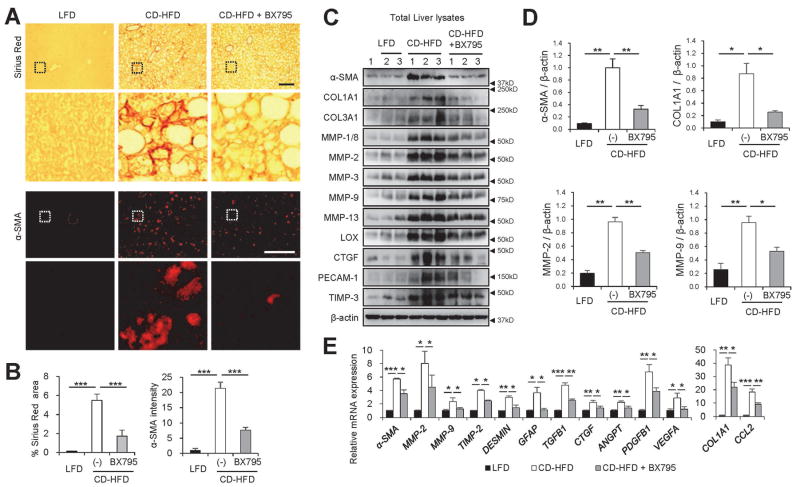
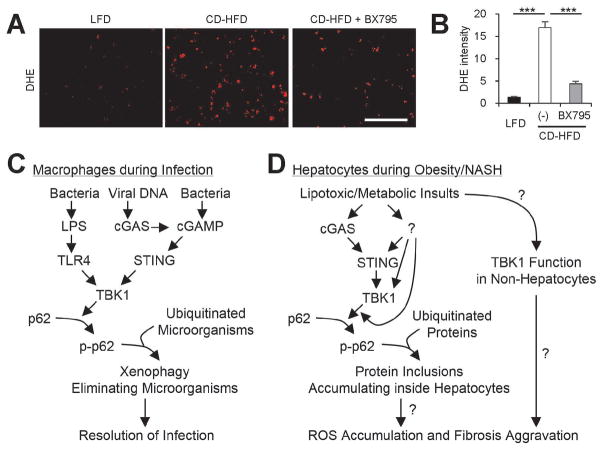
Obesity commonly leads to hepatic steatosis, which often provokes lipotoxic injuries to hepatocytes that cause nonalcoholic steatohepatitis (NASH). NASH, in turn, is associated with the accumulation of insoluble protein aggregates that are composed of ubiquitinated proteins and ubiquitin adaptor p62/sequestosome 1 (SQSTM1). Formation of p62 inclusions in hepatocytes is the critical marker that distinguishes simple fatty liver from NASH and predicts a poor prognostic outcome for subsequent liver carcinogenesis. However, the molecular mechanism by which lipotoxicity induces protein aggregation is currently unknown. Here, we show that, upon saturated fatty acid-induced lipotoxicity, TANK binding kinase 1 (TBK1) is activated and phosphorylates p62. TBK1-mediated p62 phosphorylation is important for lipotoxicity-induced aggregation of ubiquitinated proteins and formation of large protein inclusions in hepatocytes. In addition, cyclic GMP-AMP synthase (cGAS) and stimulator of interferon genes (STING), upstream regulators of TBK1, are involved in lipotoxic activation of TBK1 and subsequent p62 phosphorylation in hepatocytes. Furthermore, TBK1 inhibition prevented formation of ubiquitin-p62 aggregates not only in cultured hepatocytes, but also in mouse models of obesity and NASH.

Conclusion: These results suggest that lipotoxic activation of TBK1 and subsequent p62 phosphorylation are critical steps in the NASH pathology of protein inclusion accumulation in hepatocytes. This mechanism can provide an explanation for how hypernutrition and obesity promote the development of severe liver pathologies, such as steatohepatitis and liver cancer, by facilitating the formation of p62 inclusions. (Hepatology 2018).


Figures

Fig. 1
Fig. 1
Saturated fatty acid (SFA)-induced lipotoxicity provokes p62/SQSTM1 phosphorylation in insoluble inclusion bodies. HepG2 cells were treated with BSA (Con), palmitic acid (PA, 500 μM), thapsigargin (Tg, 1μM), bafilomycin A1 (Baf, 100 nM) or PA + verapamil (0.1, 1, or 10 μM) for 9 h and subjected to the following analyses. (A,B) Cells were subjected to immunostaining (A) and immunoblotting (B). Arrows indicate band shifts of p62. (C) PA-untreated (Con) and -treated cell lysates were subjected to immunoprecipitation (IP) using anti-p62 antibody or control IgG. IP complex and whole cell lysates were analyzed by immunoblotting. Background non-specific and IgG chain bands were identified from p62 and ubiquitin blots, respectively, and used as loading controls. Arrows indicate positions of shifted (black) and unshifted (grey) p62 bands. (D) Cells were subjected to serial protein extraction (solubility fractionation) with indicated concentration of Triton X-100 (TX100) or sodium dodecyl sulfate (SDS) and analyzed by immunoblotting with indicated antibodies (left panel) and quantified (right panels). (E,F) Cells were subjected to immunostaining with indicated antibodies (upper panels) and analyzed by line-scan evaluation of each signal across protein inclusions (lower panels). DNA was stained with DAPI (blue). Boxed areas in fluorescence images are magnified in right-most panels. Scale bars, 5 μm. Quantification data are shown as mean ± s.e.m. ***P < 0.001 (Student’s t-test). Arrowheads indicate the exact or nearest position of the protein molecular weight markers (kD).
Fig. 2
Fig. 2
SFA induces TBK1 activation and aggregation with phosphorylated p62. HepG2 cells were treated with BSA (Con), palmitic acid (PA, 500 μM), thapsigargin (Tg, 1μM), bafilomycin A1 (Baf, 100 nM), tunicamycin (Tm, 5 μg/ml), verapamil (Ver, 50 μM), nicardipine (Nic, 100 μM), stearic acid (SA, 500 μM), oleic acid (OA, 500 μM), and/or docosahexaenoic acid (DHA, 500 μM) for 9 h, followed by immunoblotting (A–D), immunoblot quantification (C,D; lower panels) and immunostaining (E,F). Immunostained images of PA-treated cells (upper panels) were analyzed by line-scan evaluation of each signal across protein inclusions (lower panels). Scale bars, 5 μm. Quantification data are shown as mean ± s.e.m. **P < 0.01 (Student’s t-test). Arrowheads indicate the exact or nearest position of the protein molecular weight markers (kD).
Fig. 3
Fig. 3
TBK1 mediates SFA-induced p62 phosphorylation and aggregation into ubiquitinated protein inclusions. (A,B) HepG2 cells were treated with BSA (Con), PA (500 μM), BSA + BX795 (20 μM), PA + BX795, BSA + Amlexanox (Amx, 100 μM), or PA + Amx for 9 h. (A) The cells were lysed, fractionated into 1% Triton X-100-soluble and insoluble fractions, and then subjected to the immunoblotting (left panels) and immunoblot quantification (right panels). (B) Cells with indicated treatments were subjected to immunostaining (upper panel). Boxed areas in fluorescence images are magnified in rightmost panels. Amount of aggregated proteins was quantified (lower panel). Scale bars, 5 μm. (C) HepG2 cells were transduced with shRNA lentiviruses targeting luciferase (sh-Con) or TBK1 (sh-TBK1 #1 and #2) and incubated for 48 h. Then the cells were treated with BSA or PA (500 μM) for 9 h, followed by subcellular fractionation, immunoblotting (upper panel) and immunoblot quantification (lower panels). TBK1 was analyzed from soluble fractions while p62, ubiquitin and β-actin were analyzed from insoluble fractions. All data are shown as mean ± s.e.m. **P < 0.01, ***P < 0.001 (Student’s t-test). Arrowheads indicate the exact or nearest position of the protein molecular weight markers (kD).
Fig. 4
Fig. 4
The cGAS-STING axis mediates SFA-induced activation of TBK1. At 48 hr after infection with shRNA lentiviruses for luciferase (sh-Con), STING (sh-STING) or cGAS (sh-cGAS#1 and #2), HepG2 cells were treated with BSA (Con) or PA (500 μM) for 9 hr. Then the cells were subjected to immunostaining (A,C), subcellular fractionation and immunoblotting (B,D; left panels) and immunoblot quantification (B,D; right panels). Boxed areas in fluorescence images are magnified in rightmost panels. Immunostained images of PA-treated control cells (A, upper panel) were analyzed by line-scan evaluation of each signal across protein inclusions (A, lower panel). Scale bars, 5 μm. Quantification data are shown as mean ± s.e.m. *P < 0.05, **P < 0.01 (Student’s t-test). Arrowheads indicate the exact or nearest position of the protein molecular weight markers (kD).
Fig. 5
Fig. 5
Inhibition of TBK1 suppresses p62 phosphorylation and accumulation in livers of obese mice. (A,B) Four-month-old C57BL/6 male mice kept on HFD for 2 months were subjected to daily administration of phosphate-buffered saline (Con, n = 7) or BX795 (25 mg/kg body weight, i.p.; n = 6) for 10 days. LFD-kept mice (n = 5) of the same age were used as a negative control. (C,D) Five-month-old littermate-controlled Tbk1F/F (n=16) and Albumin-Cre/Tbk1F/F (n=16) male mice of C57BL/6 background, kept on HFD for 3 months, were analyzed. (A,C) Livers were subjected to solubility fractionation. 1% Triton X-100-soluble and -insoluble fractions were analyzed by immunoblotting and immunoblot quantification. (B,D) Liver sections were subjected to p62 immunostaining. Hematoxylin counterstaining was used to visualize nuclei. Boxed areas in top panels are magnified in bottom panels. Scale bars, 200 μm. All data are shown as mean ± s.e.m. *P < 0.05, **P < 0.01, ***P < 0.001 (Student’s t-test). Arrowheads indicate the exact or nearest position of the protein molecular weight markers (kD).
Fig. 6
Fig. 6
Inhibition of TBK1 suppresses NASH-associated p62 phosphorylation and protein inclusion without alleviating hepatosteatosis and liver damage. (A–E) Four-month-old C57BL/6 male mice kept on methionine-restricted choline-deficient (CD)-HFD for 2 months were subjected to daily administration of vehicle (Con, 5% Tween-80 and 5% PEG-400; n = 10) or BX795 (25 mg/kg body weight, i.p.; n = 5) for 10 days. LFD-kept mice (n = 5) of the same age were used as a negative control. (A) Livers were subjected to solubility fractionation. 1% Triton X-100-insoluble fractions were analyzed by immunoblotting (left panel) and immunoblot quantification (right panels). (B,D) Liver sections were subjected to p62 and F4/80 immunostaining, hematoxylin and eosin (H&E) staining, Oil Red O (ORO) staining and Terminal deoxynucleotidyl transferase dUTP Nick-End Labeling (TUNEL) staining. Hematoxylin counterstaining was used to visualize nuclei. Scale bars, 200 μm. Boxed areas are magnified in the insets. (C) Serum ALT levels were quantified. (E) Relative F4/80 expression was quantified through RT-PCR. All data are shown as mean ± s.e.m. NS, not statistically significant; *P < 0.05, **P < 0.01, ***P < 0.001 (Student’s t-test). Arrowheads indicate the exact or nearest position of the protein molecular weight markers (kD).
Fig. 7
Fig. 7
Inhibition of TBK1 suppresses liver fibrosis induced by NASH. (A–E) The mice described in Fig. 6 were also analyzed by the following experiments. (A) Liver sections were subjected to Sirius Red staining and α-smooth muscle actin (α-SMA) immunostaining. Scale bars, 200 μm. Boxed areas are magnified in the bottom panel. (B) Areas positive for Sirius Red (left panel) or α-SMA fluorescence intensity (right panel) were quantified. (C and D) Total liver lysates were analyzed by immunoblotting (C) and immunoblot quantification (D). (E) Relative mRNA expression was quantified through RT-PCR. All data are shown as mean ± s.e.m. *P < 0.05, **P < 0.01, ***P < 0.001 (Student’s t-test). Arrowheads indicate the exact or nearest position of the protein molecular weight markers (kD).
Fig. 8
Fig. 8
Inhibition of TBK1 suppresses hepatic oxidative stress during NASH. (A) Fresh frozen liver sections from mice described in Fig. 6 were analyzed by dihydroethidium (DHE) staining, which visualizes reactive oxygen species (ROS). Scale bars, 200 μm. (B) DHE fluorescence intensity was quantified. Data are shown as mean ± s.e.m. ***P < 0.001 (Student’s t-test). (C) During infection, TBK1-dependent p62 phosphorylation induces aggregation of ubiquitinated microorganisms, making them better substrates for autophagy, which leads to quicker microorganism elimination. (D) During obesity and NAFLD, lipotoxic activation of TBK1 signaling provokes the formation of p62-ubiquitin aggregates. Due to autophagy defects, hepatocytes cannot efficiently eliminate these aggregates, leading to the formation of large protein inclusions during NASH. These protein inclusions can provoke sublethal ROS accumulation, which can culminate in the development of fibrosis during NASH. In addition, lipotoxicity may also increase TBK1 signaling in non-hepatocytes, such as hepatic stellate cells and immune cells, which may contribute to the fibrotic pathologies. Question marks denote the mechanistic connections that still need to be established by future investigations.

References

    1. Scherer PE, Hill JA. Obesity, Diabetes, and Cardiovascular Diseases: A Compendium. Circ Res. 2016;118:1703–1705. - PMC - PubMed
    1. Cusi K. Role of obesity and lipotoxicity in the development of nonalcoholic steatohepatitis: pathophysiology and clinical implications. Gastroenterology. 2012;142:711–725. e716. - PubMed
    1. Zatloukal K, Stumptner C, Fuchsbichler A, Heid H, Schnoelzer M, Kenner L, Kleinert R, et al. p62 Is a common component of cytoplasmic inclusions in protein aggregation diseases. Am J Pathol. 2002;160:255–263. - PMC - PubMed
    1. Strnad P, Nuraldeen R, Guldiken N, Hartmann D, Mahajan V, Denk H, Haybaeck J. Broad spectrum of hepatocyte inclusions in humans, animals, and experimental models. Compr Physiol. 2013;3:1393–1436. - PubMed
    1. Kucukoglu O, Guldiken N, Chen Y, Usachov V, El-Heliebi A, Haybaeck J, Denk H, et al. High-fat diet triggers Mallory-Denk body formation through misfolding and crosslinking of excess keratin 8. Hepatology. 2014;60:169–178. - PubMed

Publication types

MeSH terms

Substances