. 2018 Feb 1;128(2):734-745.
doi: 10.1172/JCI97032. Epub 2017 Dec 18.

Microglia ablation alleviates myelin-associated catatonic signs in mice

Affiliations

Microglia ablation alleviates myelin-associated catatonic signs in mice

Hana Janova et al. J Clin Invest. .

Abstract

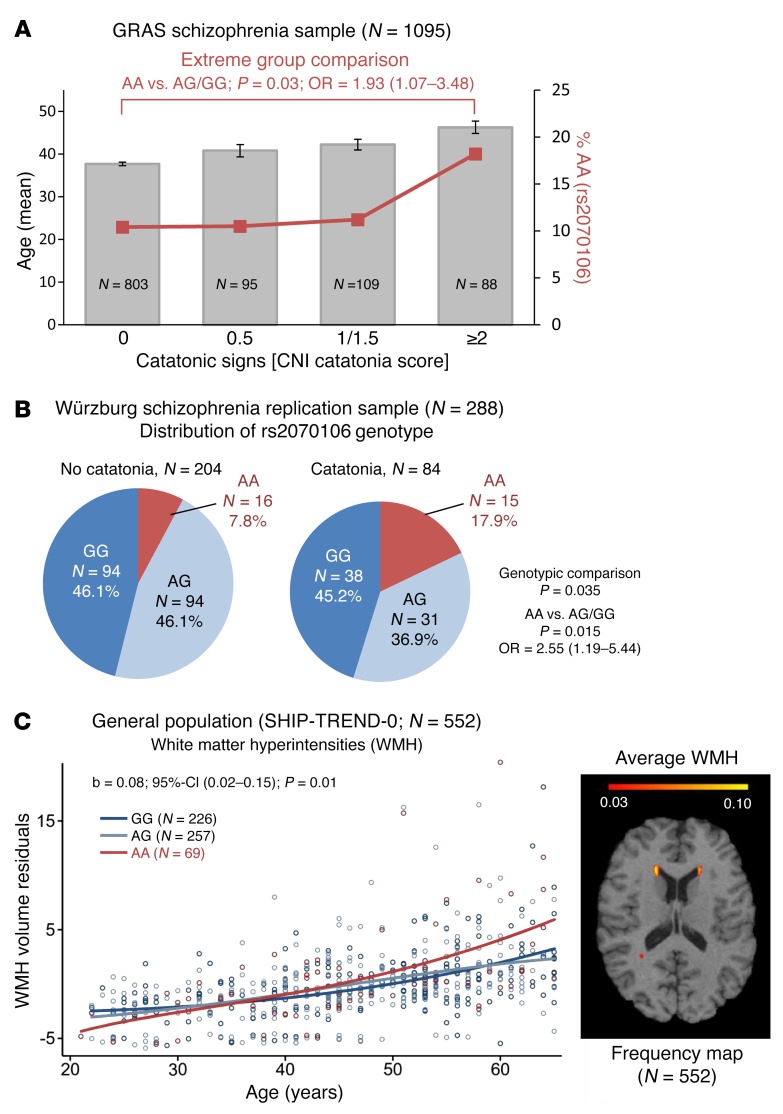
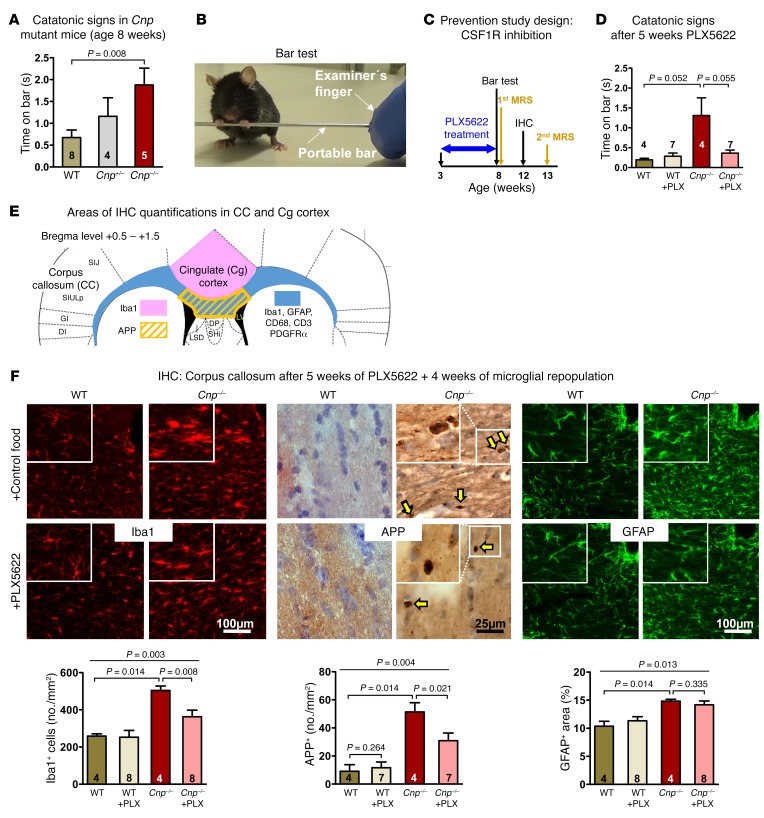
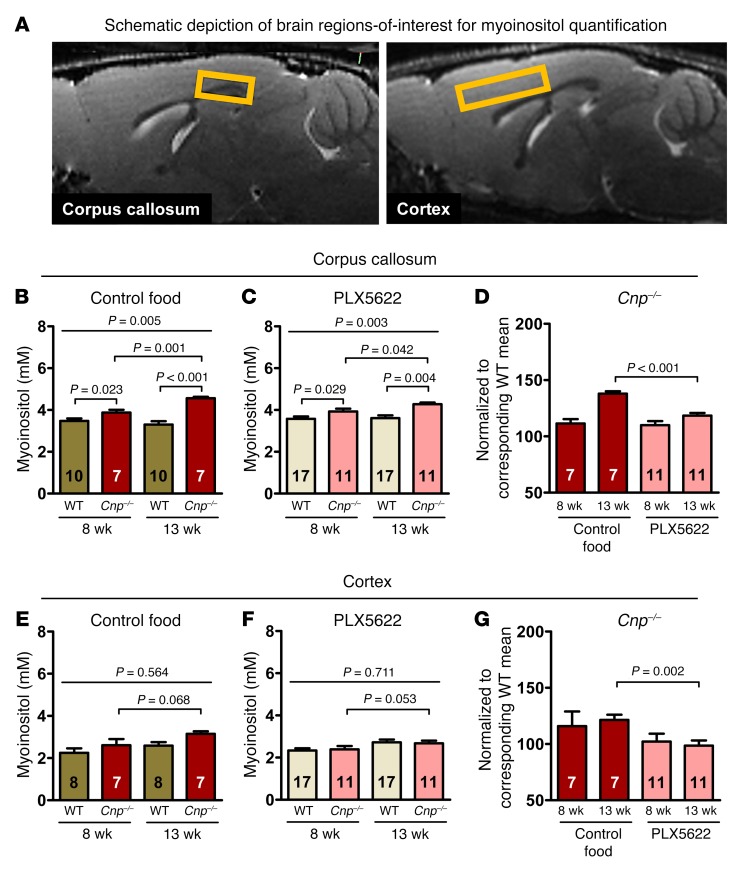
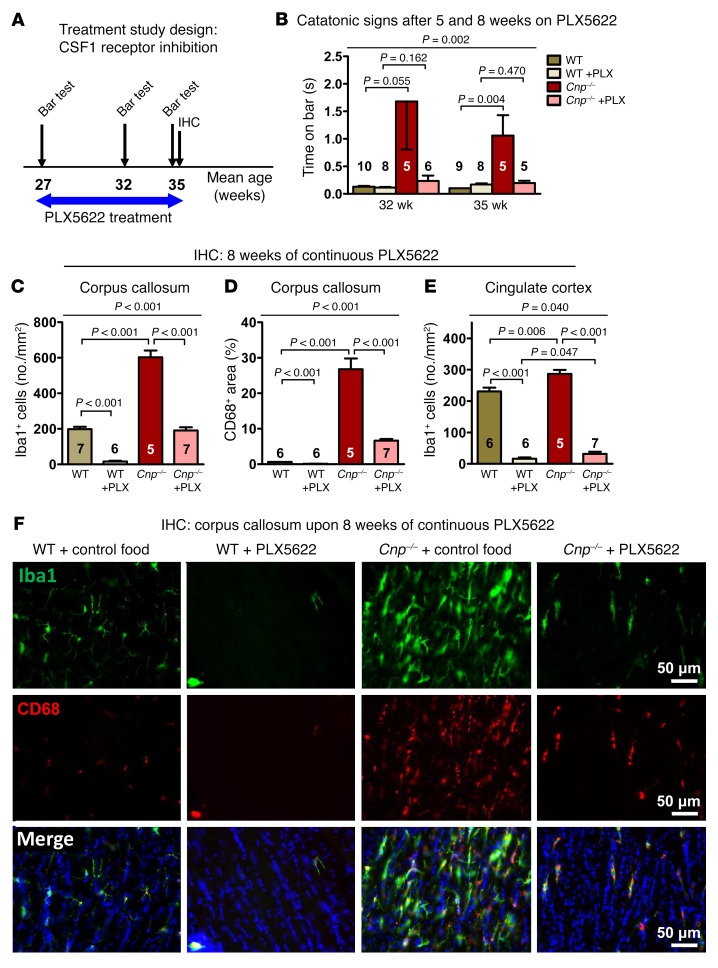
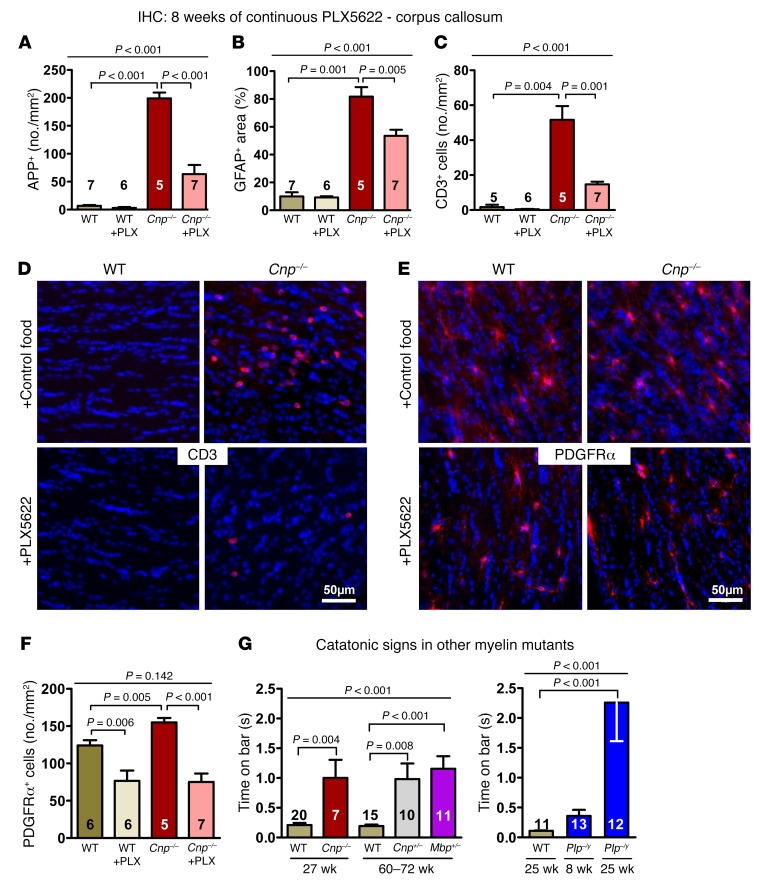
The underlying cellular mechanisms of catatonia, an executive "psychomotor" syndrome that is observed across neuropsychiatric diseases, have remained obscure. In humans and mice, reduced expression of the structural myelin protein CNP is associated with catatonic signs in an age-dependent manner, pointing to the involvement of myelin-producing oligodendrocytes. Here, we showed that the underlying cause of catatonic signs is the low-grade inflammation of white matter tracts, which marks a final common pathway in Cnp-deficient and other mutant mice with minor myelin abnormalities. The inhibitor of CSF1 receptor kinase signaling PLX5622 depleted microglia and alleviated the catatonic symptoms of Cnp mutants. Thus, microglia and low-grade inflammation of myelinated tracts emerged as the trigger of a previously unexplained mental condition. We observed a very high (25%) prevalence of individuals with catatonic signs in a deeply phenotyped schizophrenia sample (n = 1095). Additionally, we found the loss-of-function allele of a myelin-specific gene (CNP rs2070106-AA) associated with catatonia in 2 independent schizophrenia cohorts and also associated with white matter hyperintensities in a general population sample. Since the catatonic syndrome is likely a surrogate marker for other executive function defects, we suggest that microglia-directed therapies may be considered in psychiatric disorders associated with myelin abnormalities.

Keywords: Demyelinating disorders; Inflammation; Mouse models; Neuroscience; Schizophrenia.


Conflict of interest statement

Conflict of interest: Brian West is an employee of Plexxikon Inc.

Figures

Figure 1
Figure 1. Age–dependent association of the loss-of-function genotype CNP rs2070106-AA with catatonia in 2 independent schizophrenia cohorts and with WMH in a general population sample.
(A) Bars show mean age of schizophrenic subjects (GRAS), sorted by severity of catatonic signs. Red line denotes percentage of risk for genotype carriers (rs2070106-AA) within each severity group. Note that severity of catatonic signs increases with age. Two-sided values for Kruskal-Wallis (P = 7.6 × 10⁻⁹) and Jonckheere-Terpstra (P = 1.3 × 10⁻⁹).Mean ± SEM. Also note that CNP rs2070106-AA carriers are most frequent (18.2%) among individuals with highest expression of catatonic signs compared with noncatatonic subjects (10.4%). Two-sided P value for Mann-Whitney U test for extreme-group comparison given in the figure. (B) Distribution of CNP rs2070106 genotype in the Würzburg replication sample of schizophrenia patients based on dichotomous catatonia classification. The AA genotype is significantly more prevalent in patients with (17.9%) than without catatonia (7.8%). Two-sided P values from χ2 test given. (C) Left panel: interaction effect between age and genotype in SHIP-TREND-0 sample on overall WMH volume (minimum 10 mm3 per single WMH cluster). Shown are WMH volume residuals after correcting for intracranial volume, age (nonlinear), and gender. Genotype and age-genotype interaction term contributed 1.1% of variance to overall WMH volumes. Right panel: frequency map averaging all subjects of the general population (SHIP-TREND-0; n = 552), analyzed here. Data highlight WMH appearance predominantly in frontal regions.
Figure 2
Figure 2. Early catatonia and white matter inflammation in Cnp mutant mice and their prevention by CSF1R inhibition.
(A) Catatonic signs measured by the bar test in WT, Cnp+/–, and Cnp–/– mice at the age of 8 weeks (Kruskal-Wallis, P = 0.034). (B) Image illustrating a mouse with typical catatonic posture during the bar test. (C) Schematic overview of the prevention study design, including PLX5622 (versus regular food) feeding phase (blue arrow) and time points of testing/analyses. Black arrows: bar test (results in Figure 2D) and IHC (results in Figure 2F); yellow arrows: MRS measurements (results in Figure 3). (D) Catatonic signs in WT and Cnp–/– mice (age 8 weeks) after 5-week PLX5622 or control food diet (Kruskal-Wallis, P = 0.165). (E) Schematic overview illustrating corpus callosum and neighboring cingulate cortex areas for IHC quantifications: defined ROI for quantifying APP+ swellings, Iba1+ and CD3+ cells as well as GFAP+ and CD68+ areas (densitometric analysis) shown by the yellow striped field and the blue area, respectively; cingulate area (Cg1/Cg2) for Iba1+ cell quantification displayed in rose. (F) IHC quantification within the corpus callosum of WT or Cnp–/– mice (age 12 weeks) at 4 weeks of microglia repopulation after 5 weeks of PLX5622 or control diet, as shown in C and E. Upper panels show representative images, including higher-magnification inserts, of the quantifications shown underneath: Iba1+ cells (no./mm2; 1 section/brain), APP+ swellings (yellow arrows indicating APP+ spheroids; no./mm2; 3 sections/brain), and densitometric analysis of GFAP+ area (%; 1 section/brain). Original magnification (insets), ×2 (Iba1, GFAP); ×4 (APP). All data in A, D, and F were individually tested for Gaussian distribution using the Kolmogorov-Smirnov test. Nonparametric Kruskal-Wallis test was performed for A, D and F for multiple group comparisons, followed by post hoc 1-tailed Mann-Whitney U test. All data are shown as mean ± SEM; n indicated within bars.
Figure 3
Figure 3. MRS signs of white matter (corpus callosum) and gray matter (cortex) inflammation (myoinositol) in Cnp–/– mice and prevention by CSF1R inhibition.
(A) Representative sagittal MR images illustrating corpus callosum and cortex ROI for analysis of myoinositol levels (yellow squares). (BD) Corpus callosum: follow-up MRS for quantification of myoinositol in WT and Cnp–/– mice at 8 and 13 weeks of age (experimental design shown in Figure 2C). Statistical comparison of the first MRS in 8-week-old mice, after 5 weeks of control (B) versus PLX5622 (C) diet (starting at age 3 weeks) and the second MRS in these same mice at the age of 13 weeks, after 5 weeks of regular food (repopulation after PLX5622). (D) Note the return to nearly WT level in PLX5622-treated Cnp–/– mice. (EG) Cortex: same design as for corpus callosum. (E) Inflammatory phenotype of Cnp–/– mice less pronounced. (F and G) Effect of PLX5622 less prominent. All data in BG were individually tested for Gaussian distribution using the Kolmogorov-Smirnov test. Two-way ANOVA was performed for B, E, and F, followed by post hoc 1-tailed t tests. Nonparametric Kruskal-Wallis test was used for multiple group comparisons in C, followed by post hoc 1-tailed Mann-Whitney U test. Two-way ANOVA for treatment × time interaction performed in D and G, followed by post hoc unpaired t test. P = 0.008 (D); P = 0.52 (G). All data shown as mean ± SEM; n indicated within bars.
Figure 4
Figure 4. Catatonia and white matter inflammation in Cnp mutant mice and their treatment by CSF1R inhibition: Part I.
(A) Schematic overview of the treatment study design, including PLX5622 (versus regular diet) feeding phase (blue arrow) and time points/age of testing/analyses (black arrows). (B) Catatonic signs in WT and Cnp–/– mice after 5 and 8 weeks on PLX5622 or control diet. (C and D) IHC quantifications in the corpus callosum (as shown in Figure 2E) at the age of 35 weeks after 8 weeks of PLX5622 or control diet: Iba1+ cells (no./mm2; 1 section/brain) and CD68+ area (%; 1 section/brain). (E) Iba1+ cells in the cingulate cortex (no./mm2; 1 section/brain; area described in Figure 2E). (F) Representative IHC images illustrating the results in C and D. All data in B, C, D, and E were individually tested for Gaussian distribution using the Kolmogorov-Smirnov test. Nonparametric Kruskal-Wallis test was performed in B for multiple group comparisons, followed by post hoc 1-tailed Mann-Whitney U test. Two-way ANOVA was performed for C, D, and F, followed by post hoc 1-tailed unpaired t test. All data are shown as mean ± SEM; n indicated within bars.
Figure 5
Figure 5. Catatonia and white matter inflammation in Cnp mutant mice and their treatment by CSF1R inhibition: Part II.
(A) APP+ swellings (indicating APP+ spheroids; no./mm2; 3 sections/brain) and (B) densitometric analysis of GFAP+ area (%; indicating astrogliosis; 1 section/brain). (C) CD3+ cells (no./mm2; indicating T lymphocyte invasion; 1 section/brain). (D and E) Representative IHC images illustrating CD3 and PDGFRα staining. (F) PDGFRα+ cells (no./mm2; indicating oligodendrocyte precursors; 1 section/brain). (G) Catatonic signs in WT, Cnp–/– (age of onset at 8 weeks of age, shown in Figure 2A), and Cnp+/– mice compared with mice with mutations in other myelin-related genes (Mbp+/–, Plp–/y). Age of onset of catatonia in heterozygous mice (Cnp+/–, Mbp+/–) seen at around 60–72 weeks and in Plp–/y mice at 25 weeks. All data in A, B, C, F, and G were individually tested for Gaussian distribution using the Kolmogorov-Smirnov test. Nonparametric Kruskal-Wallis test was performed for B, C, and G for multiple group comparisons, followed by post hoc 1-tailed Mann-Whitney U test. Two-way ANOVA was performed for A and F, followed by post hoc 1-tailed unpaired t test. All data are shown as mean ± SEM; n indicated within bars.

Comment in

References

    1. Nave KA, Werner HB. Myelination of the nervous system: mechanisms and functions. Annu Rev Cell Dev Biol. 2014;30:503–533. doi: 10.1146/annurev-cellbio-100913-013101. - DOI - PubMed
    1. Filley CM, Fields RD. White matter and cognition: making the connection. J Neurophysiol. 2016;116(5):2093–2104. doi: 10.1152/jn.00221.2016. - DOI - PMC - PubMed
    1. Nave KA, Ehrenreich H. Myelination and oligodendrocyte functions in psychiatric diseases. JAMA Psychiatry. 2014;71(5):582–584. doi: 10.1001/jamapsychiatry.2014.189. - DOI - PubMed
    1. Fink M, Taylor MA. Catatonia: a clinician’s guide to diagnosis and treatment. Cambridge, UK: Cambridge University Press; 2003.
    1. Tandon R, et al. Catatonia in DSM-5. Schizophr Res. 2013;150(1):26–30. doi: 10.1016/j.schres.2013.04.034. - DOI - PubMed

Publication types

MeSH terms

Substances