

A fingerprint of the epileptogenic zone in human epilepsies
- PMID: 29253102
- PMCID: PMC5837527
- DOI: 10.1093/brain/awx306
A fingerprint of the epileptogenic zone in human epilepsies
Abstract
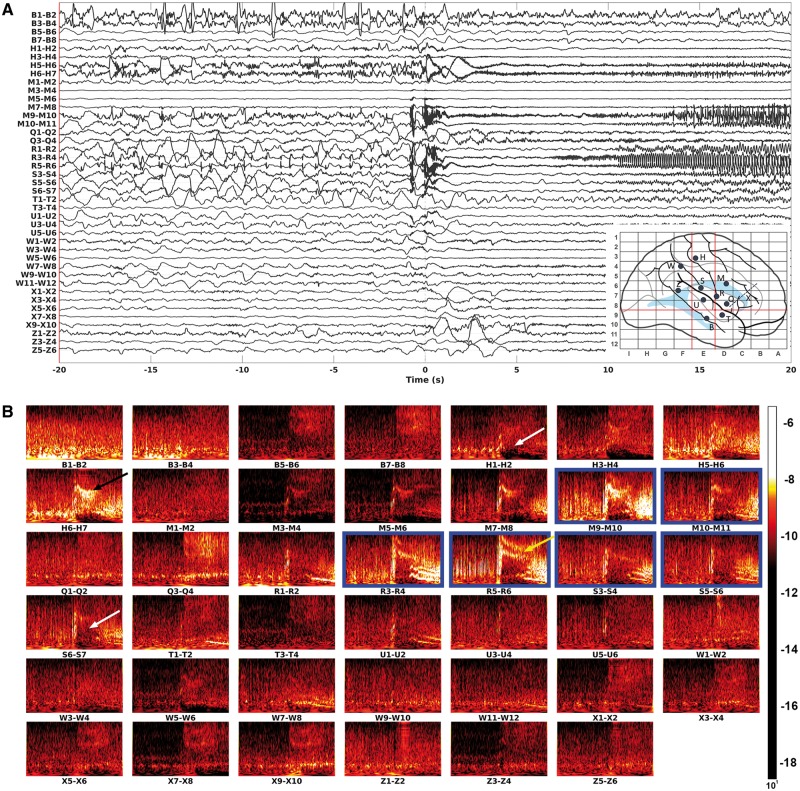
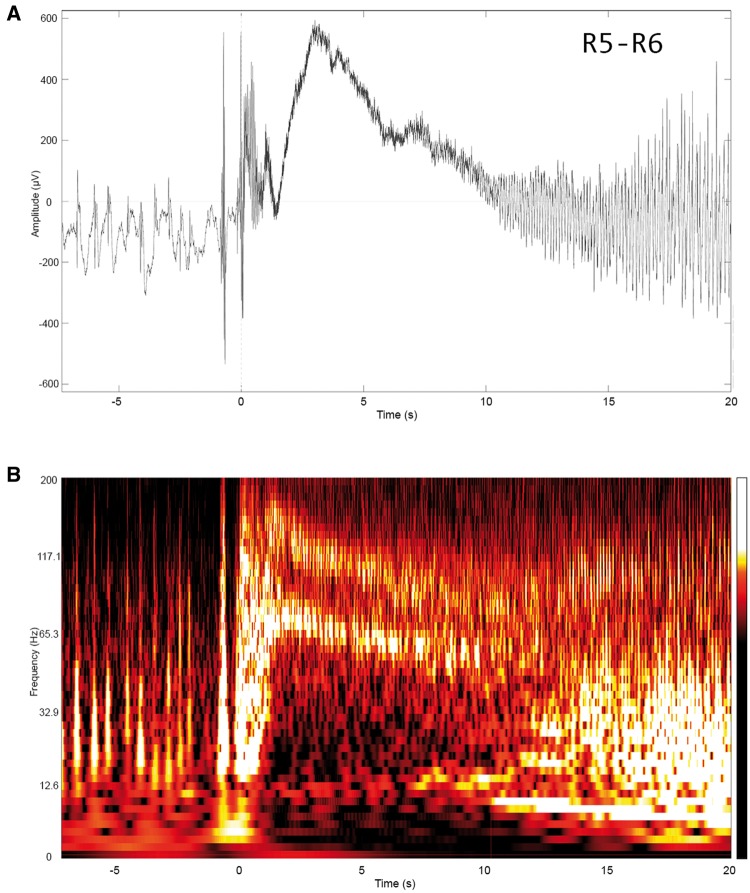
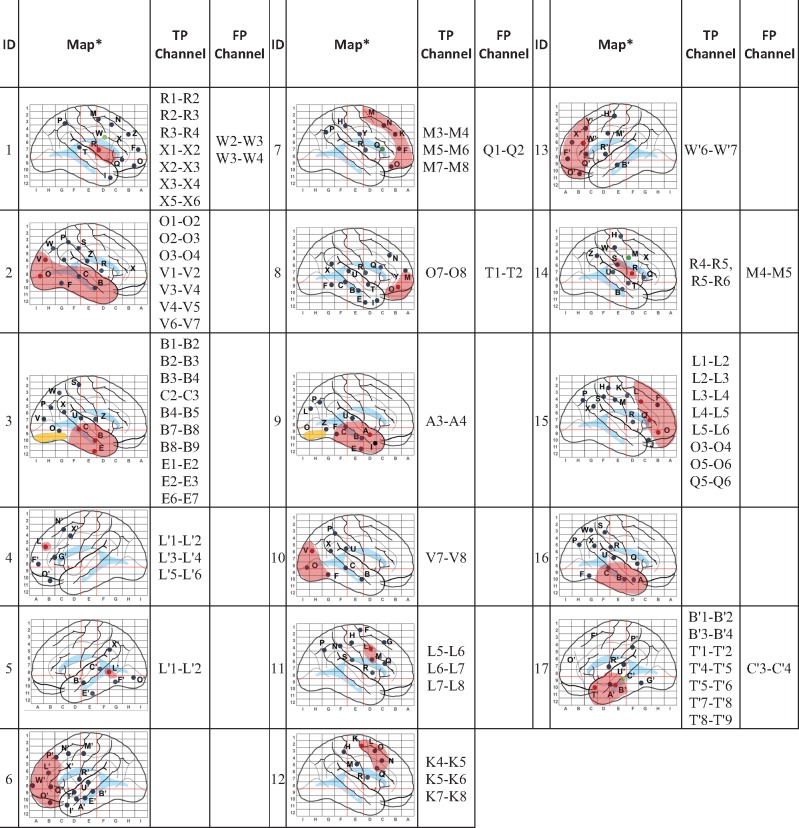
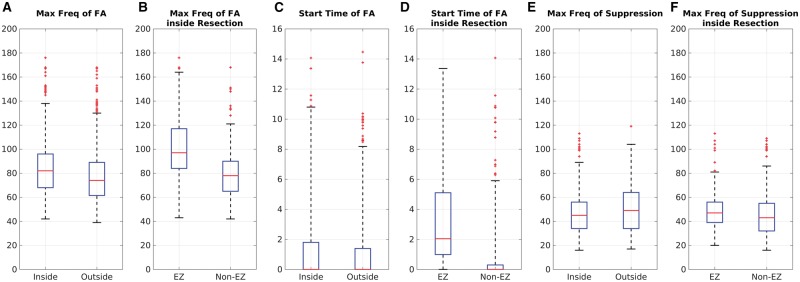
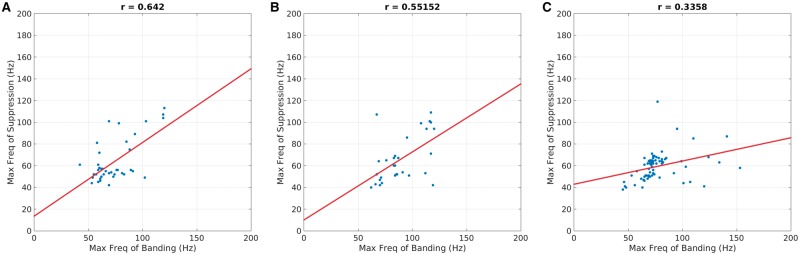
Defining a bio-electrical marker for the brain area responsible for initiating a seizure remains an unsolved problem. Fast gamma activity has been identified as the most specific marker for seizure onset, but conflicting results have been reported. In this study, we describe an alternative marker, based on an objective description of interictal to ictal transition, with the aim of identifying a time-frequency pattern or 'fingerprint' that can differentiate the epileptogenic zone from areas of propagation. Seventeen patients who underwent stereoelectroencephalography were included in the study. Each had seizure onset characterized by sustained gamma activity and were seizure-free after tailored resection or laser ablation. We postulated that the epileptogenic zone was always located inside the resection region based on seizure freedom following surgery. To characterize the ictal frequency pattern, we applied the Morlet wavelet transform to data from each pair of adjacent intracerebral electrode contacts. Based on a visual assessment of the time-frequency plots, we hypothesized that a specific time-frequency pattern in the epileptogenic zone should include a combination of (i) sharp transients or spikes; preceding (ii) multiband fast activity concurrent; with (iii) suppression of lower frequencies. To test this hypothesis, we developed software that automatically extracted each of these features from the time-frequency data. We then used a support vector machine to classify each contact-pair as being within epileptogenic zone or not, based on these features. Our machine learning system identified this pattern in 15 of 17 patients. The total number of identified contacts across all patients was 64, with 58 localized inside the resected area. Subsequent quantitative analysis showed strong correlation between maximum frequency of fast activity and suppression inside the resection but not outside. We did not observe significant discrimination power using only the maximum frequency or the timing of fast activity to differentiate contacts either between resected and non-resected regions or between contacts identified as epileptogenic versus non-epileptogenic. Instead of identifying a single frequency or a single timing trait, we observed the more complex pattern described above that distinguishes the epileptogenic zone. This pattern encompasses interictal to ictal transition and may extend until seizure end. Its time-frequency characteristics can be explained in light of recent models emphasizing the role of fast inhibitory interneurons acting on pyramidal cells as a prominent mechanism in seizure triggering. The pattern clearly differentiates the epileptogenic zone from areas of propagation and, as such, represents an epileptogenic zone 'fingerprint'.awx306media15687076823001.
Keywords: epilepsy surgery; epileptogenic zone; high-frequency oscillations; imaging methodology; stereo-EEG.
© The Author (2017). Published by Oxford University Press on behalf of the Guarantors of Brain.
Figures

Comment in
-
Toward the "Fingerprint" of the Ictal Onset Zone - Is Mr. Morlet the Winner?Epilepsy Curr. 2018 May-Jun;18(3):158-159. doi: 10.5698/1535-7597.18.3.158. Epilepsy Curr. 2018. PMID: 29950936 Free PMC article. No abstract available.
References
-
- Aubert S, Wendling F, Regis J, McGonigal A, Figarella-Branger D, Peragut JC, et al. Local and remote epileptogenicity in focal cortical dysplasias and neurodevelopmental tumours. Brain 2009; 132: 3072–86. - PubMed
-
- Baillet S, Mosher JC, Leahy RM. Electromagnetic brain mapping. IEEE Signal Process Mag 2001; 18: 14–30.
-
- Bancaud J, Angelergues R, Bernouilli C, Bonis A, Bordas-Ferrer M, Bresson M, et al. Functional stereotaxic exploration (SEEG) of epilepsy. Electroencephalogr Clin Neurophysiol 1970; 28: 85–6. - PubMed
-
- Bancaud J, Talairach J. La Stéréo-électroencéphalographie dans l’épilepsie: informations neurophysiopathologiques apportées par l’investigation fonctionnelle stéréotaxique. Paris: Masson; 1965.
-
- Banks MI, White JA, Pearce RA. Interactions between distinct GABA(A) circuits in hippocampus. Neuron 2000; 25: 449–57. - PubMed
Publication types
MeSH terms
Grants and funding
LinkOut - more resources
Full Text Sources
Other Literature Sources
Medical
