

Population-level impact, herd immunity, and elimination after human papillomavirus vaccination: a systematic review and meta-analysis of predictions from transmission-dynamic models
- PMID: 29253379
- PMCID: PMC6727207
- DOI: 10.1016/S2468-2667(16)30001-9
Population-level impact, herd immunity, and elimination after human papillomavirus vaccination: a systematic review and meta-analysis of predictions from transmission-dynamic models
Abstract
Background: Modelling studies have been widely used to inform human papillomavirus (HPV) vaccination policy decisions; however, many models exist and it is not known whether they produce consistent predictions of population-level effectiveness and herd effects. We did a systematic review and meta-analysis of model predictions of the long-term population-level effectiveness of vaccination against HPV 16, 18, 6, and 11 infection in women and men, to examine the variability in predicted herd effects, incremental benefit of vaccinating boys, and potential for HPV-vaccine-type elimination.
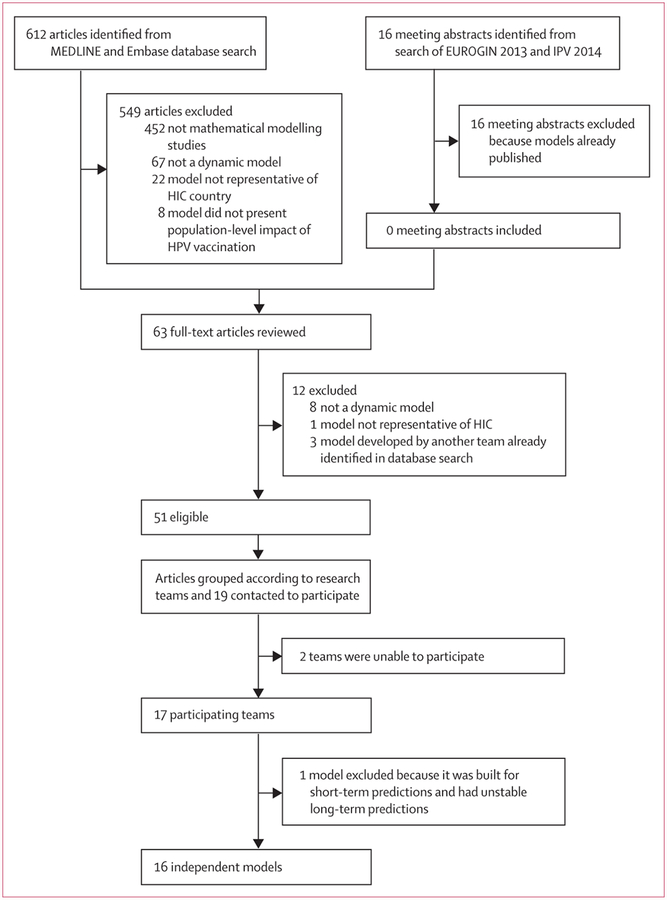
Methods: We searched MEDLINE and Embase for transmission-dynamic modelling studies published between Jan 1, 2009, and April 28, 2015, that predicted the population-level impact of vaccination on HPV 6, 11, 16, and 18 infections in high-income countries. We contacted authors to determine whether they were willing to produce new predictions for standardised scenarios. Strategies investigated were girls-only vaccination and girls and boys vaccination at age 12 years. Base-case vaccine characteristics were 100% efficacy and lifetime protection. We did sensitivity analyses by varying vaccination coverage, vaccine efficacy, and duration of protection. For all scenarios we pooled model predictions of relative reductions in HPV prevalence (RRprev) over time after vaccination and summarised results using the median and 10th and 90th percentiles (80% uncertainty intervals [UI]).
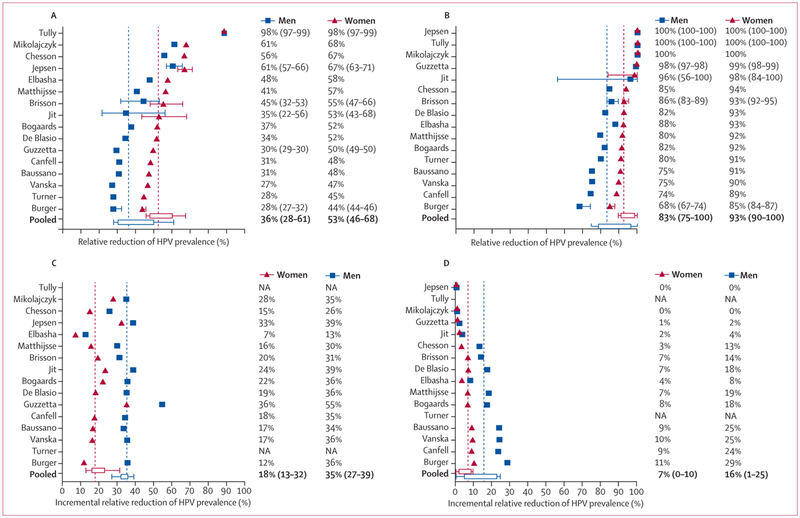
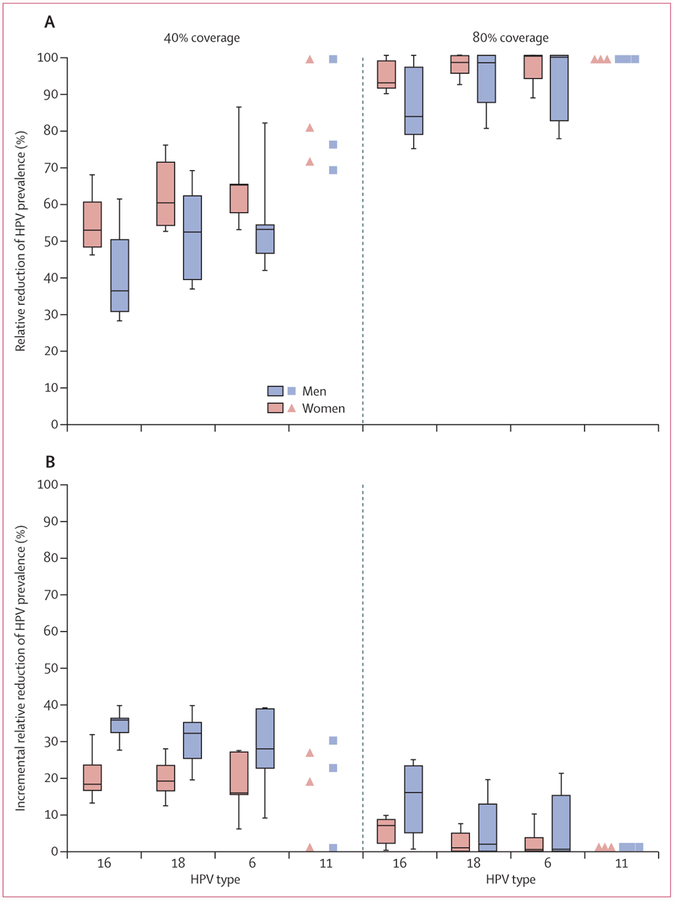
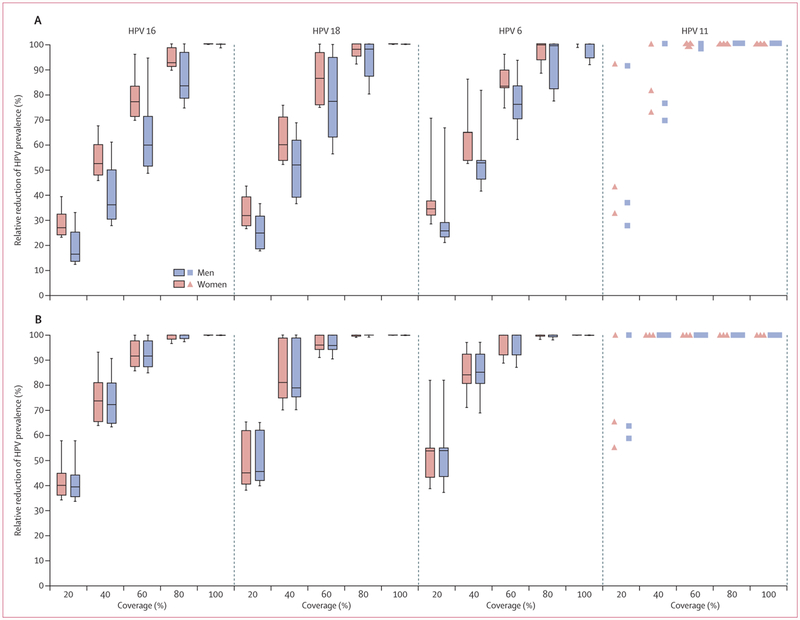
Findings: 16 of 19 eligible models from ten high-income countries provided predictions. Under base-case assumptions, 40% vaccination coverage and girls-only vaccination, the RRprev of HPV 16 among women and men was 0·53 (80% UI 0·46-0·68) and 0·36 (0·28-0·61), respectively, after 70 years. With 80% girls-only vaccination coverage, the RRprev of HPV 16 among women and men was 0·93 (0·90-1·00) and 0·83 (0·75-1·00), respectively. Vaccinating boys in addition to girls increased the RRprev of HPV 16 among women and men by 0·18 (0·13-0·32) and 0·35 (0·27-0·39) for 40% coverage, and 0·07 (0·00-0·10) and 0·16 (0·01-0·25) for 80% coverage, respectively. The RRprev were greater for HPV 6, 11, and 18 than for HPV 16 for all scenarios investigated. Finally at 80% coverage, most models predicted that girls and boys vaccination would eliminate HPV 6, 11, 16, and 18, with a median RRprev of 1·00 for women and men for all four HPV types. Variability in pooled findings was low, but increased with lower vaccination coverage and shorter vaccine protection (from lifetime to 20 years).
Interpretation: Although HPV models differ in structure, data used for calibration, and settings, our population-level predictions were generally concordant and suggest that strong herd effects are expected from vaccinating girls only, even with coverage as low as 20%. Elimination of HPV 16, 18, 6, and 11 is possible if 80% coverage in girls and boys is reached and if high vaccine efficacy is maintained over time.
Funding: Canadian Institutes of Health Research.
Copyright © 2016 The Author(s). Published by Elsevier Ltd. This is an Open Access article under the CC BY-NC-ND license. Published by Elsevier Ltd.. All rights reserved.
Figures
Comment in
-
HPV vaccination in boys should not be discounted.Lancet Public Health. 2016 Nov;1(1):e2-e3. doi: 10.1016/S2468-2667(16)30003-2. Epub 2016 Sep 27. Lancet Public Health. 2016. PMID: 29253377 No abstract available.
References
-
- Munoz N, Bosch FX, de Sanjose S, et al. Epidemiologic classification of human papillomavirus types associated with cervical cancer. N Engl J Med 2003; 348: 518–27. - PubMed
-
- De Vuyst H, Clifford GM, Nascimento MC, Madeleine MM, Franceschi S. Prevalence and type distribution of human papillomavirus in carcinoma and intraepithelial neoplasia of the vulva, vagina and anus: a meta-analysis. Int J Cancer 2009; 124: 1626–36. - PubMed
-
- Kreimer AR, Clifford GM, Boyle P, Franceschi S. Human papillomavirus types in head and neck squamous cell carcinomas worldwide: a systematic review. Cancer Epidemiol Biomarkers Prev 2005; 14: 467–75. - PubMed
-
- Guan P, Howell-Jones R, Li N, et al. Human papillomavirus types in 115,789 HPV-positive women: A meta-analysis from cervical infection to cancer. Int J Cancer 2012; 131: 2349–59. - PubMed
Publication types
MeSH terms
Substances
Grants and funding
LinkOut - more resources
Full Text Sources
Other Literature Sources
Miscellaneous
