

MicroRNA-31-3p Is Involved in Substance P (SP)-Associated Inflammation in Human Colonic Epithelial Cells and Experimental Colitis
- PMID: 29253460
- PMCID: PMC5840489
- DOI: 10.1016/j.ajpath.2017.10.023
MicroRNA-31-3p Is Involved in Substance P (SP)-Associated Inflammation in Human Colonic Epithelial Cells and Experimental Colitis
Abstract
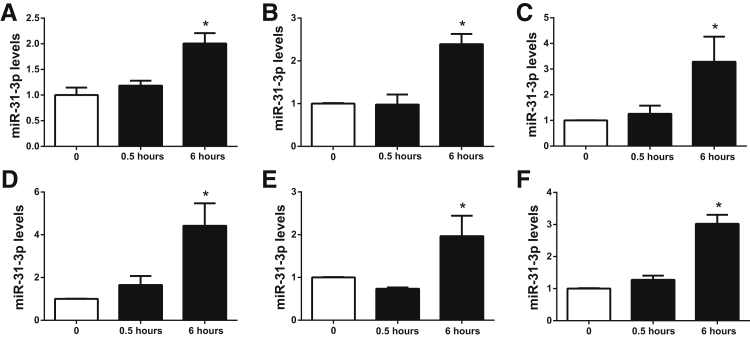
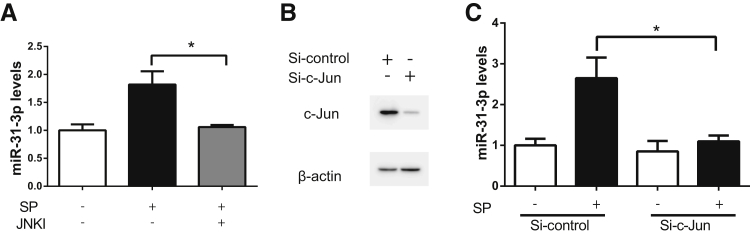
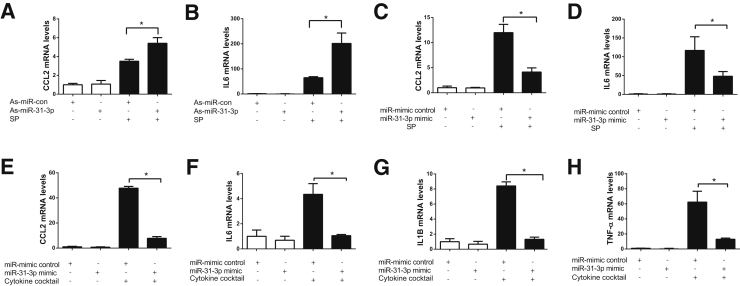
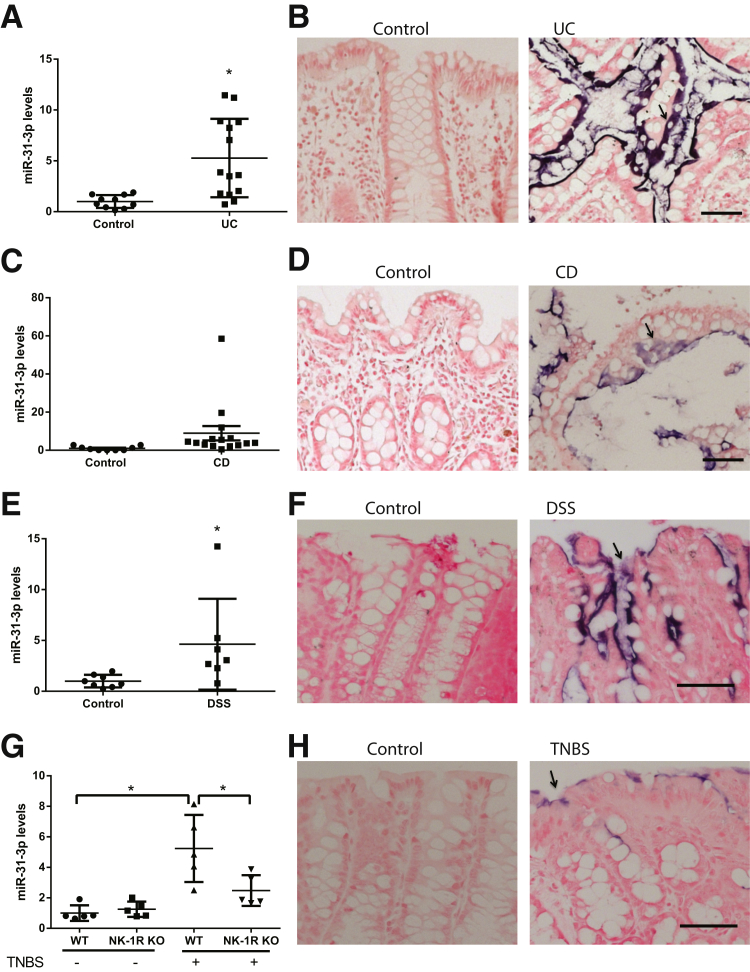
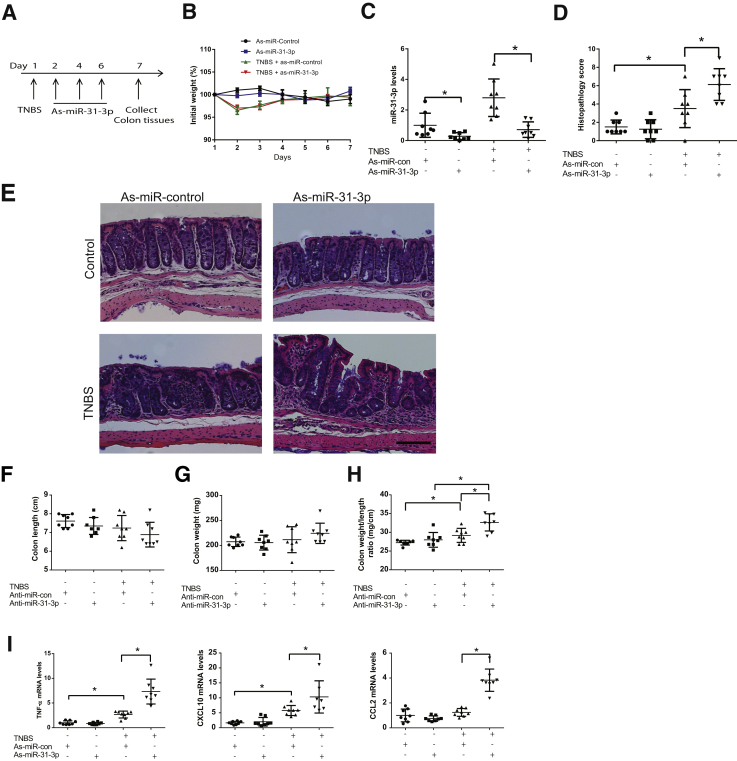
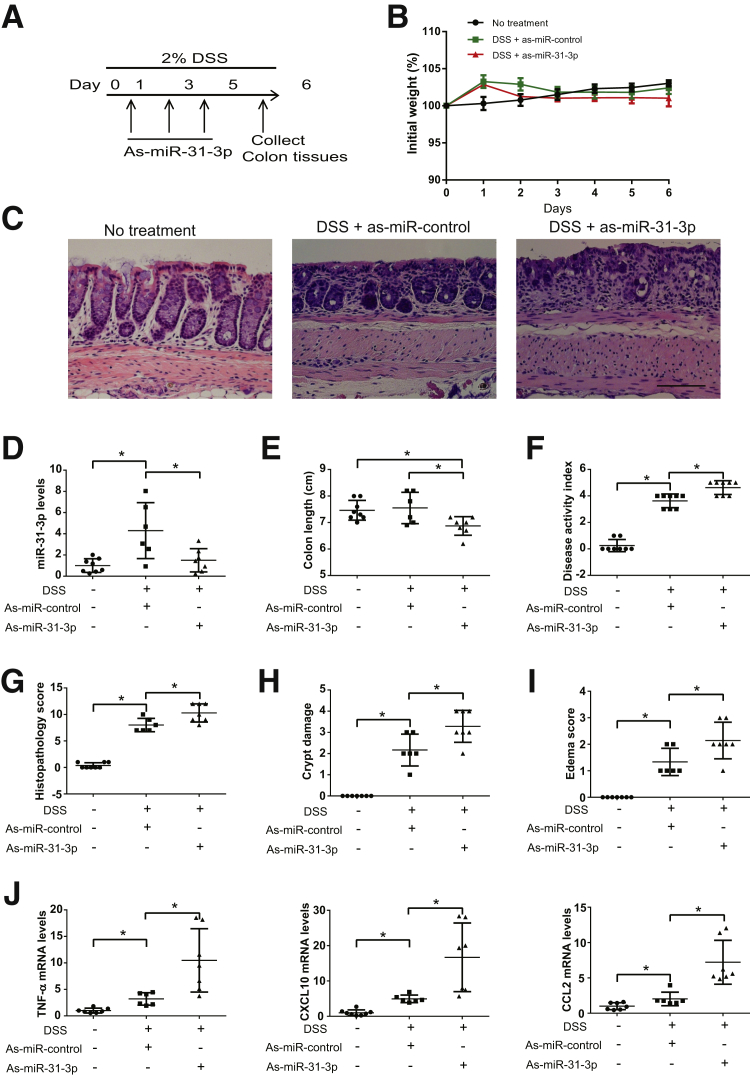
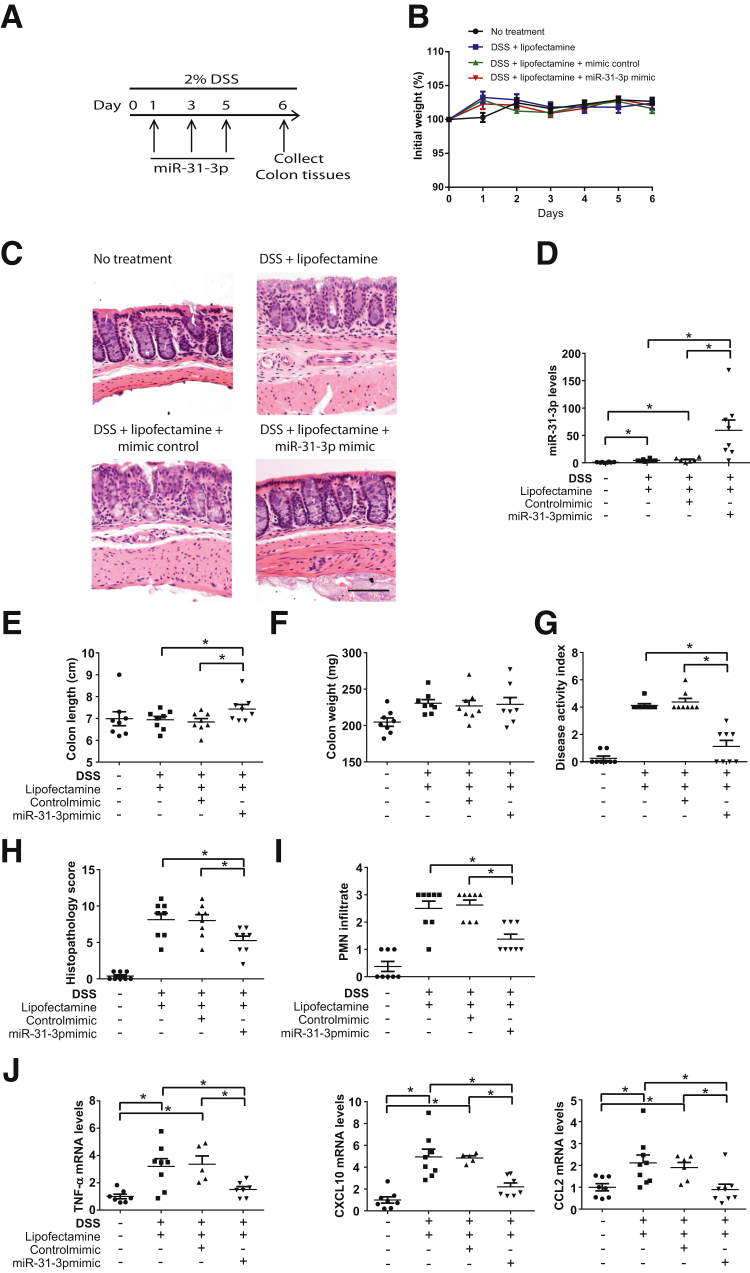
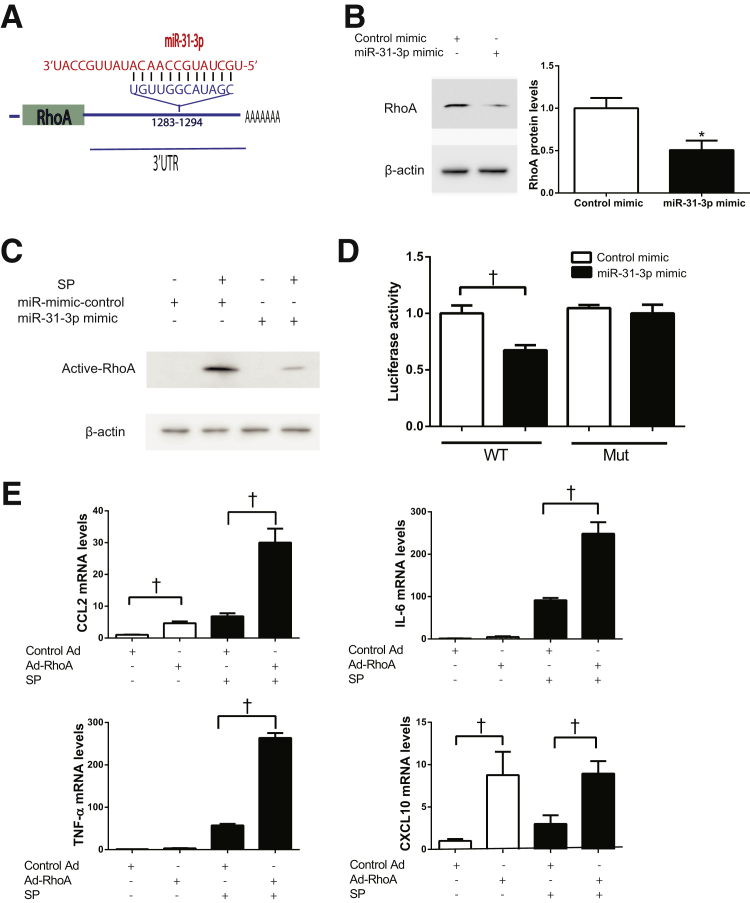
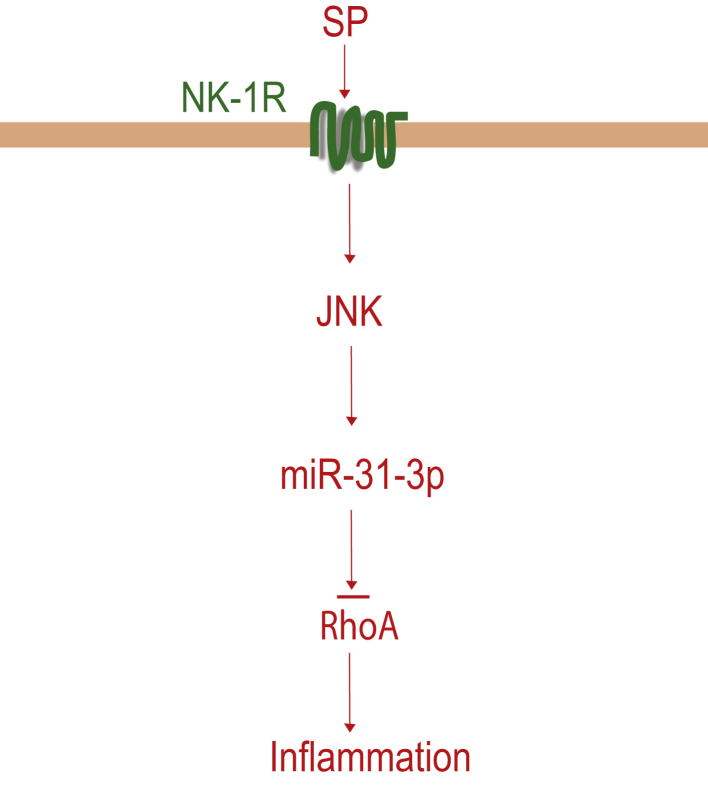
Substance P (SP) mediates colitis. SP signaling regulates the expression of several miRNAs, including miR-31-3p, in human colonocytes. However, the role of miR-31-3p in colitis and the underlying mechanisms has not been elucidated. We performed real-time PCR analysis of miR-31-3p expression in human colonic epithelial cells overexpressing neurokinin-1 receptor (NCM460 NK-1R) in response to SP stimulation and in NCM460 cells after IL-6, IL8, tumor necrosis factor (TNF)-α, and interferon-γ exposure. Functions of miR-31-3p were tested in NCM460-NK-1R cells and the trinitrobenzene sulfonic acid (TNBS) and dextran sodium sulfate (DSS) models of colitis. Targets of miRNA-31-3p were confirmed by Western blot analysis and luciferase reporter assay. Jun N-terminal kinase inhibition decreased SP-induced miR-31-3p expression. miR-31-3p expression was increased in both TNBS- and DSS-induced colitis and human colonic biopsies from ulcerative colitis, compared with controls. Intracolonic administration of a miR-31-3p chemical inhibitor exacerbated TNBS- and DSS-induced colitis and increased colonic TNF-α, CXCL10, and chemokine (C-C motif) ligand 2 (CCL2) mRNA expression. Conversely, overexpression of miR-31-3p ameliorated the severity of DSS-induced colitis. Bioinformatic, luciferase reporter assay, and Western blot analyses identified RhoA as a target of miR-31-3p in NCM460 cells. Constitutive activation of RhoA led to increased expression of CCL2, IL6, TNF-α, and CXCL10 in NCM460-NK-1R cells on SP stimulation. Our results reveal a novel SP-miR-31-3p-RhoA pathway that protects from colitis. The use of miR-31-3p mimics may be a promising approach for colitis treatment.
Copyright © 2018 American Society for Investigative Pathology. Published by Elsevier Inc. All rights reserved.
Figures
Similar articles
-
MiR-21 in Substance P-induced exosomes promotes cell proliferation and migration in human colonic epithelial cells.Am J Physiol Gastrointest Liver Physiol. 2019 Dec 1;317(6):G802-G810. doi: 10.1152/ajpgi.00043.2019. Epub 2019 Sep 23. Am J Physiol Gastrointest Liver Physiol. 2019. PMID: 31545921 Free PMC article.
-
Identification of a novel substance P (SP)-neurokinin-1 receptor (NK-1R) microRNA-221-5p inflammatory network in human colonic epithelial cells.Cell Mol Gastroenterol Hepatol. 2015 Sep 1;1(5):503-515. doi: 10.1016/j.jcmgh.2015.06.008. Cell Mol Gastroenterol Hepatol. 2015. PMID: 26645045 Free PMC article.
-
Substance P induces CCN1 expression via histone deacetylase activity in human colonic epithelial cells.Am J Pathol. 2011 Nov;179(5):2315-26. doi: 10.1016/j.ajpath.2011.07.038. Epub 2011 Sep 23. Am J Pathol. 2011. PMID: 21945803 Free PMC article.
-
miR-141 Regulates colonic leukocytic trafficking by targeting CXCL12β during murine colitis and human Crohn's disease.Gut. 2014 Aug;63(8):1247-57. doi: 10.1136/gutjnl-2012-304213. Epub 2013 Sep 2. Gut. 2014. PMID: 24000293
-
Induction of colitis and its analyses.2021 Sep 2 [updated 2022 Apr 5]. In: Nishihara S, Angata K, Aoki-Kinoshita KF, Hirabayashi J, editors. Glycoscience Protocols (GlycoPODv2) [Internet]. Saitama (JP): Japan Consortium for Glycobiology and Glycotechnology; 2021–. 2021 Sep 2 [updated 2022 Apr 5]. In: Nishihara S, Angata K, Aoki-Kinoshita KF, Hirabayashi J, editors. Glycoscience Protocols (GlycoPODv2) [Internet]. Saitama (JP): Japan Consortium for Glycobiology and Glycotechnology; 2021–. PMID: 37590676 Free Books & Documents. Review. No abstract available.
Cited by
-
MicroRNA signatures in the pathogenesis and therapy of inflammatory bowel disease.Clin Exp Med. 2024 Sep 11;24(1):217. doi: 10.1007/s10238-024-01476-z. Clin Exp Med. 2024. PMID: 39259390 Free PMC article. Review.
-
Current Knowledge on Exosome Biogenesis, Cargo-Sorting Mechanism and Therapeutic Implications.Membranes (Basel). 2022 May 6;12(5):498. doi: 10.3390/membranes12050498. Membranes (Basel). 2022. PMID: 35629824 Free PMC article. Review.
-
MiR-21 in Substance P-induced exosomes promotes cell proliferation and migration in human colonic epithelial cells.Am J Physiol Gastrointest Liver Physiol. 2019 Dec 1;317(6):G802-G810. doi: 10.1152/ajpgi.00043.2019. Epub 2019 Sep 23. Am J Physiol Gastrointest Liver Physiol. 2019. PMID: 31545921 Free PMC article.
-
Altered miRNA expression in duodenal tissue of celiac patients and the impact of a gluten-free diet: a preliminary study.Mol Biol Rep. 2025 Apr 30;52(1):441. doi: 10.1007/s11033-025-10534-y. Mol Biol Rep. 2025. PMID: 40304865 Free PMC article.
-
MicroRNA-31-3p/RhoA signaling in the dorsal hippocampus modulates methamphetamine-induced conditioned place preference in mice.Psychopharmacology (Berl). 2021 Nov;238(11):3207-3219. doi: 10.1007/s00213-021-05936-2. Epub 2021 Jul 27. Psychopharmacology (Berl). 2021. PMID: 34313802
References
-
- Valencia-Sanchez M.A., Liu J., Hannon G.J., Parker R. Control of translation and mRNA degradation by miRNAs and siRNAs. Genes Dev. 2006;20:515–524. - PubMed
-
- Iliopoulos D. MicroRNA circuits regulate the cancer-inflammation link. Sci Signal. 2014;7:pe8. - PubMed
-
- Nguyen H.T., Dalmasso G., Muller S., Carriere J., Seibold F., Darfeuille-Michaud A. Crohn's disease-associated adherent invasive Escherichia coli modulate levels of microRNAs in intestinal epithelial cells to reduce autophagy. Gastroenterology. 2014;146:508–519. - PubMed
-
- Koukos G., Polytarchou C., Kaplan J.L., Morley-Fletcher A., Gras-Miralles B., Kokkotou E., Baril-Dore M., Pothoulakis C., Winter H.S., Iliopoulos D. MicroRNA-124 regulates STAT3 expression and is down-regulated in colon tissues of pediatric patients with ulcerative colitis. Gastroenterology. 2013;145:842–852.e2. - PMC - PubMed
-
- Wu F., Zikusoka M., Trindade A., Dassopoulos T., Harris M.L., Bayless T.M., Brant S.R., Chakravarti S., Kwon J.H. MicroRNAs are differentially expressed in ulcerative colitis and alter expression of macrophage inflammatory peptide-2 alpha. Gastroenterology. 2008;135:1624–1635.e24. - PubMed
Publication types
MeSH terms
Substances
Grants and funding
LinkOut - more resources
Full Text Sources
Other Literature Sources
Research Materials
Miscellaneous
