. 2017 Dec 18;15(12):e2004086.
doi: 10.1371/journal.pbio.2004086. eCollection 2017 Dec.

Fundamental properties of the mammalian innate immune system revealed by multispecies comparison of type I interferon responses

Affiliations

Fundamental properties of the mammalian innate immune system revealed by multispecies comparison of type I interferon responses

Andrew E Shaw et al. PLoS Biol. .

Abstract

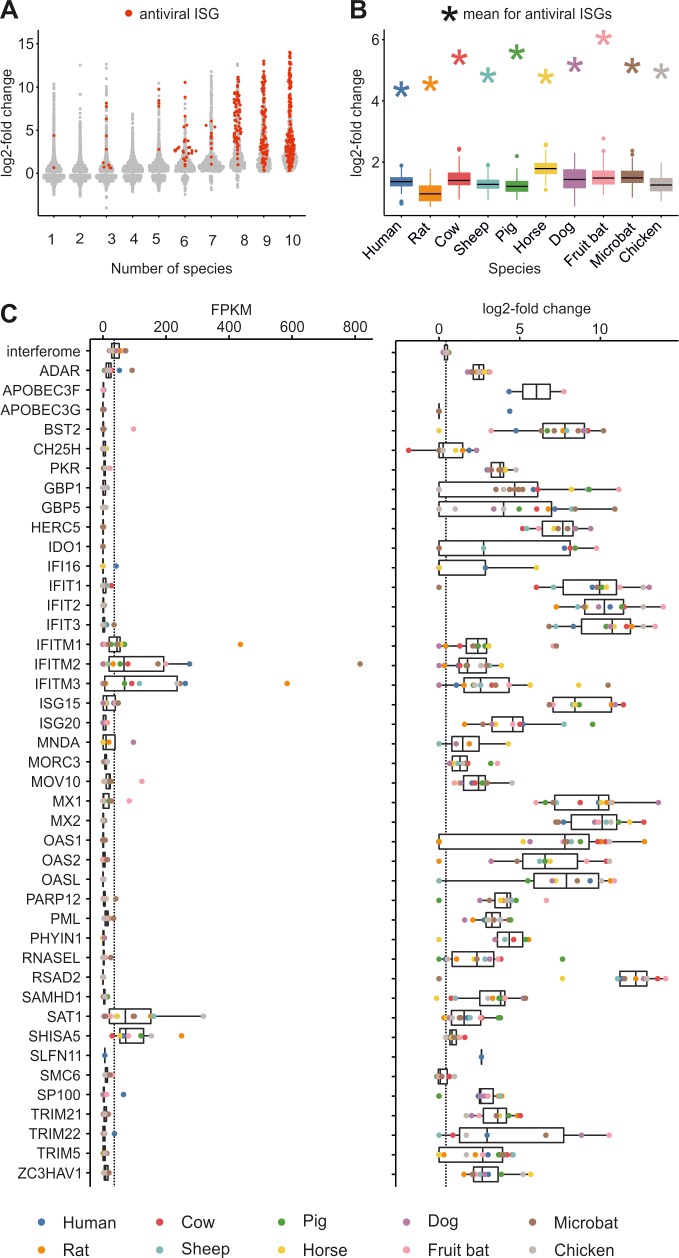
The host innate immune response mediated by type I interferon (IFN) and the resulting up-regulation of hundreds of interferon-stimulated genes (ISGs) provide an immediate barrier to virus infection. Studies of the type I 'interferome' have mainly been carried out at a single species level, often lacking the power necessary to understand key evolutionary features of this pathway. Here, using a single experimental platform, we determined the properties of the interferomes of multiple vertebrate species and developed a webserver to mine the dataset. This approach revealed a conserved 'core' of 62 ISGs, including genes not previously associated with IFN, underscoring the ancestral functions associated with this antiviral host response. We show that gene expansion contributes to the evolution of the IFN system and that interferomes are shaped by lineage-specific pressures. Consequently, each mammal possesses a unique repertoire of ISGs, including genes common to all mammals and others unique to their specific species or phylogenetic lineages. An analysis of genes commonly down-regulated by IFN suggests that epigenetic regulation of transcription is a fundamental aspect of the IFN response. Our study provides a resource for the scientific community highlighting key paradigms of the type I IFN response.


Conflict of interest statement

The authors have declared that no competing interests exist.

Figures

Fig 1
Fig 1. Patterns of differential gene expression in response to type I IFN among cells from the 10 vertebrate species used in this study.
(A) The patterns of differential expression of ISGs and IRGs are broadly similar in cells derived from 10 different animal species. Each dot in the panel represents a gene that is differentially expressed in response to type I IFN treatment (S1 Data). (B) Number of ISGs (above line, red arrow) and IRGs (below line, blue arrow) are plotted on the branches of a simplified phylogenetic tree (branch lengths are not shown to scale). ISGs common to every species (n = 62) are located at the root of the tree with an additional 28 ISGs up-regulated by all mammalian species used in this study. At the tips of the tree lie genes that are only up- or down-regulated in an individual species in our study. (C) Normalised correlation matrix showing pairwise comparisons between ISGs (red) and IRGs (blue) of the indicated animal species (S1 Data). (D) A PCA of the log2FC data of the one-to-one orthologs up-regulated by all nine mammalian species used in this study (S1 Data). Each point represents an animal or experiment, coloured according to species. The distribution of the samples reflects expression patterns. Separate animals/experiments cluster according to species, with the pig and human showing similar patterns. (E) A heatmap of the relative expression of the 62 vertebrate core ISGs. The first row (labelled as ‘Interferome’) represents the average log2FC of all up-regulated ISGs for each animal species. Up-regulated paralogs have been averaged in the case of genes for which there are expansions; for example, the rat has two copies of MX1 compared to the single copy in the remaining species (S1 Data). IFN, interferon; IRGs, interferon-repressed genes; ISGs, interferon-stimulated genes; log2FC, log2 fold change; PCA, principal component analysis.
Fig 2
Fig 2. Basal transcription levels and IFN-induced expression of genes related to PAMP sensing and IFN induction and response.
Boxplots showing differential expression (log2FC) in response to IFN and basal transcription levels (expressed as FPKM) of genes associated with pattern recognition (sensors), downstream signal transduction (adapters), and transcription factors related to either IFN induction or response (transcription factors). Every ortholog for each gene is indicated with a dot coloured according to their presence in the DNA-, RNA-, or both DNA- and RNA-sensing pathways (S1 Data). FPKM, fragments per kilobase mapped values; IFN, interferon; log2FC, log2 fold change; PAMP, pathogen-associated molecular pattern.
Fig 3
Fig 3. Properties of antiviral ISGs.
(A) Sinaplot showing the differential expression values (log2FC) of 40 genes previously published as exerting antiviral activity (red dots) (S2 Table) as opposed to the rest of the ISGs (grey dots). ISGs (including antiviral ISGs) were allocated to bins according to the number of species in which they were found to be up- or down-regulated (i.e., the corevert ISGs are bin 10). The majority of antiviral ISGs (red) were found to be up-regulated in at least eight species (S1 Data). (B) Graph showing the extent of up-regulation of antiviral ISGs compared to nonantiviral ISGs. The mean log2FC of 40 known antiviral ISGs (indicated with an asterisk on the plot) is compared to 100 samplings of 40 randomly selected ISGs from the interferome of each species (box and whiskers). In all cases, antiviral ISGs are up-regulated to a significantly greater extent as compared to nonantiviral ISGs (P < 0.01 for each species). The code used for random sampling and the generation of Fig 3B is available in S2 Data, with the required input files available as S5 Data and S6 Data. (C) Boxplots showing basal transcription levels (expressed as FPKM) and differential expression (log2FC) in response to IFN of known antiviral ISGs as in panels A and B. Every ortholog for each gene is indicated with a dot coloured according to species. The median FPKM value for the entire interferome is indicated with a broken line (S1 Data). FPKM, fragments per kilobase mapped values; IFN, interferon; ISGs, interferon-stimulated genes; log2FC, log2 fold change.
Fig 4
Fig 4. Evolutionary properties of ISGs.
(A) For each nonhuman species, ISGs with one-to-one orthologs that were up-regulated in the human interferome and an identical number of random genes not differentially expressed by IFN stimulation were selected. dN and dS values were then retrieved from the Ensembl database. Histograms show dN/dS ratio values for ISGs (blue) and non-ISGs (red). Differences in the distribution of dN/dS values of the non-ISGs compared to ISGs were tested using the Kruskal–Wallis rank sum test and Wilcoxon rank sum test with continuity correction. (B) The extent of gene expansion was compared between ISGs and the genome as a whole. The y-axis represents the ratio between the number of genes for which there are paralogs (multiple) and those which are orthologs (single) as a proxy for gene expansion. Boxes and whiskers represent the values for 500 randomly selected non-ISGs, while ‘×’ represents the mean value for the ISGs for each species. With the exception of the sheep, all ISG values were above the median value. The code used for the random sampling and the generation of Fig 4A and 4B is provided in S3 Data and S4 Data, respectively, with the input file available as S5 Data. (C) Up- or down-regulated genes were divided into bins according to the number of species in which they were differentially expressed. The extent of gene expansion was calculated as panel B (S1 Data). A positive trend was identified for up-regulated genes whereby the greater the number of species which up-regulate a gene, the greater the likelihood of copies being retained (P < 0.05). IFN, interferon; ISGs, interferon-stimulated genes; K-W, Kruskal-Wallis; W, Wilcoxon rank sum test.
Fig 5
Fig 5. In silico screening of coremamm ISGs in mammalian genomes.
(A) A heatmap displaying the results of a similarity search–based screen of 111 mammalian genomes for sequences disclosing homology to mammalian core ISGs. Each column represents a distinct mammalian species, while each row represents a coremamm ISG. Numbers on the left of each row identify each ISG as listed in S3 Table. Column numbers refer to species (S4 Table). Colours are proportional to the number of matches found in each genome, normalised by the median hit count for that gene across the Mammalia. Because the method is based upon sequence-similarity screening, high count levels for a particular gene do not necessarily reflect gene expansion. Note that the grey boxes indicate that no matches were identified, either due to a bona fide deletion or as a result of relatively poor quality of the genomes. Note that only 79 coremamm ISGs are included in the analysis. Some of the coremamm ISGs were excluded from this analysis because of their high levels of similarity between each other posing a risk for spurious results. (B) A cartoon of syntenic loci showing the absence of IFIT3 and pseudogenisation of IFIT2 in cetaceans. ISGs, interferon-stimulated genes.

References

    1. Woolhouse MEJ, Gowtage-Sequeria S. Host range and emerging and reemerging pathogens. Emerg Infect Dis. Centers for Disease Control and Prevention; 2005;11: 1842–7. doi: 10.3201/eid1112.050997 - DOI - PMC - PubMed
    1. Reperant LA, Brown IH, Haenen OL, de Jong MD, Osterhaus ADME, Papa A, et al. Companion Animals as a Source of Viruses for Human Beings and Food Production Animals. J Comp Pathol. 2016;155: S41–S53. doi: 10.1016/j.jcpa.2016.07.006 - DOI - PubMed
    1. Schoggins JW, Wilson SJ, Panis M, Murphy MY, Jones CT, Bieniasz P, et al. A diverse range of gene products are effectors of the type I interferon antiviral response. Nature. NIH Public Access; 2011;472: 481–5. doi: 10.1038/nature09907 - DOI - PMC - PubMed
    1. Schoggins JW, Rice CM. Interferon-stimulated genes and their antiviral effector functions. Curr Opin Virol. NIH Public Access; 2011;1: 519–25. doi: 10.1016/j.coviro.2011.10.008 - DOI - PMC - PubMed
    1. Daugherty MD, Malik HS. Rules of Engagement: Molecular Insights from Host-Virus Arms Races. Annu Rev Genet. Annual Reviews; 2012;46: 677–700. doi: 10.1146/annurev-genet-110711-155522 - DOI - PubMed

Publication types

MeSH terms

Substances