

Optimized adaptive enrichment designs
- PMID: 29254436
- PMCID: PMC6613177
- DOI: 10.1177/0962280217747312
Optimized adaptive enrichment designs
Abstract
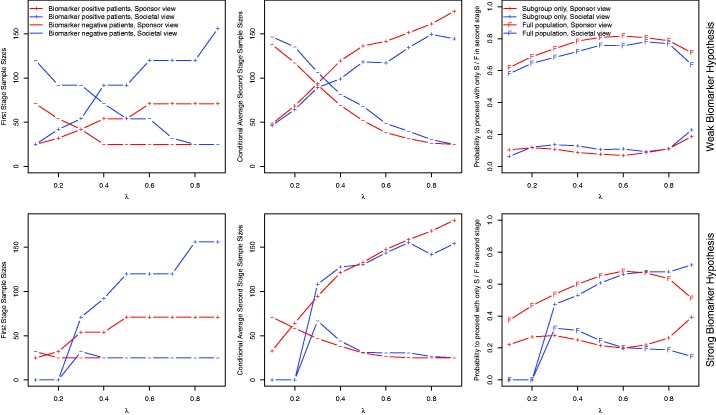
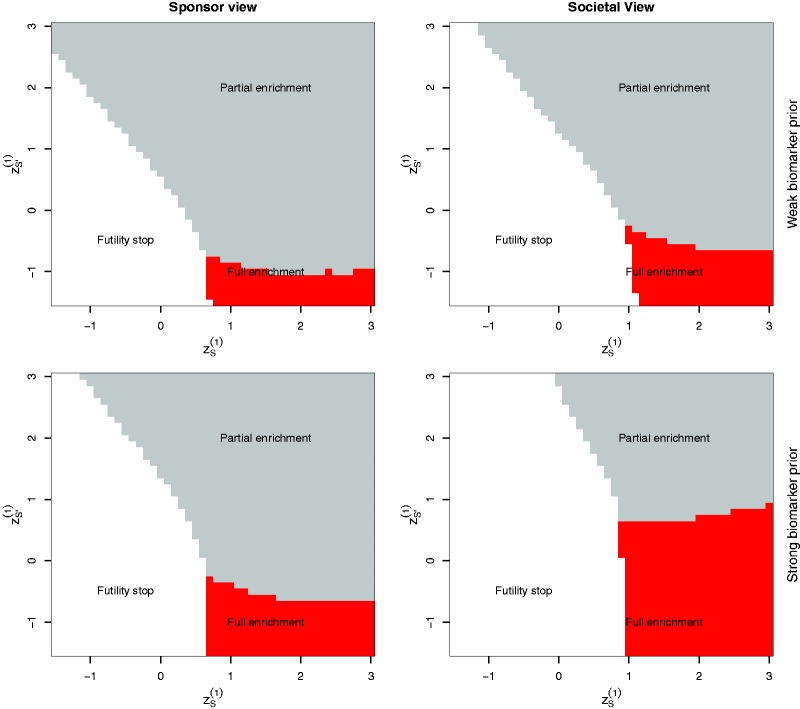
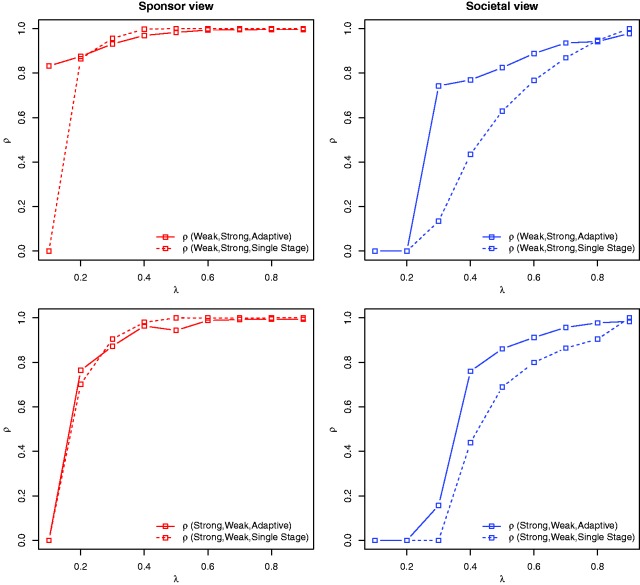
Based on a Bayesian decision theoretic approach, we optimize frequentist single- and adaptive two-stage trial designs for the development of targeted therapies, where in addition to an overall population, a pre-defined subgroup is investigated. In such settings, the losses and gains of decisions can be quantified by utility functions that account for the preferences of different stakeholders. In particular, we optimize expected utilities from the perspectives both of a commercial sponsor, maximizing the net present value, and also of the society, maximizing cost-adjusted expected health benefits of a new treatment for a specific population. We consider single-stage and adaptive two-stage designs with partial enrichment, where the proportion of patients recruited from the subgroup is a design parameter. For the adaptive designs, we use a dynamic programming approach to derive optimal adaptation rules. The proposed designs are compared to trials which are non-enriched (i.e. the proportion of patients in the subgroup corresponds to the prevalence in the underlying population). We show that partial enrichment designs can substantially improve the expected utilities. Furthermore, adaptive partial enrichment designs are more robust than single-stage designs and retain high expected utilities even if the expected utilities are evaluated under a different prior than the one used in the optimization. In addition, we find that trials optimized for the sponsor utility function have smaller sample sizes compared to trials optimized under the societal view and may include the overall population (with patients from the complement of the subgroup) even if there is substantial evidence that the therapy is only effective in the subgroup.
Keywords: Adaptive design; enrichment design; optimal design; precision medicine; subgroup analysis.
Figures


References
-
- Lipkovich I, Dmitrienko A, D'Agostino RB. Tutorial in biostatistics: exploratory subgroup analysis in clinical trials. Stat Med 2017; 36: 136–196. - PubMed
-
- Alosh M, Huque MF, Bretz F, et al. Tutorial on statistical considerations on subgroup analysis in confirmatory clinical trials. Stat Med 2016; 36: 1334–1360. - PubMed
-
- Millen BA, Dmitrienko A, Ruberg S, et al. A statistical framework for decision making in confirmatory multipopulation tailoring clinical trials. Ther Innov Regul Sci 2012; 46: 647–656.
Publication types
MeSH terms
Substances
LinkOut - more resources
Full Text Sources
Other Literature Sources
Medical
