

Decision making and uncertainty quantification for individualized treatments using Bayesian Additive Regression Trees
- PMID: 29254443
- PMCID: PMC6028324
- DOI: 10.1177/0962280217746191
Decision making and uncertainty quantification for individualized treatments using Bayesian Additive Regression Trees
Abstract
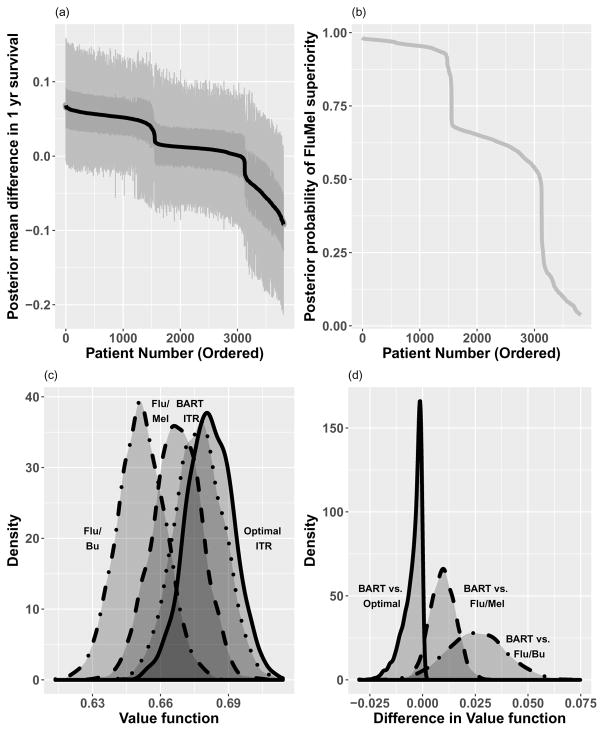
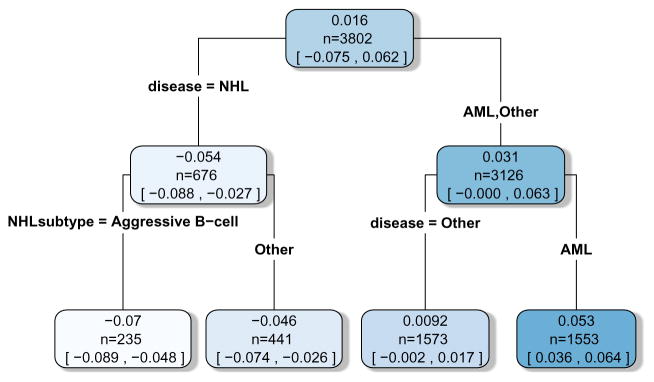
Individualized treatment rules can improve health outcomes by recognizing that patients may respond differently to treatment and assigning therapy with the most desirable predicted outcome for each individual. Flexible and efficient prediction models are desired as a basis for such individualized treatment rules to handle potentially complex interactions between patient factors and treatment. Modern Bayesian semiparametric and nonparametric regression models provide an attractive avenue in this regard as these allow natural posterior uncertainty quantification of patient specific treatment decisions as well as the population wide value of the prediction-based individualized treatment rule. In addition, via the use of such models, inference is also available for the value of the optimal individualized treatment rules. We propose such an approach and implement it using Bayesian Additive Regression Trees as this model has been shown to perform well in fitting nonparametric regression functions to continuous and binary responses, even with many covariates. It is also computationally efficient for use in practice. With Bayesian Additive Regression Trees, we investigate a treatment strategy which utilizes individualized predictions of patient outcomes from Bayesian Additive Regression Trees models. Posterior distributions of patient outcomes under each treatment are used to assign the treatment that maximizes the expected posterior utility. We also describe how to approximate such a treatment policy with a clinically interpretable individualized treatment rule, and quantify its expected outcome. The proposed method performs very well in extensive simulation studies in comparison with several existing methods. We illustrate the usage of the proposed method to identify an individualized choice of conditioning regimen for patients undergoing hematopoietic cell transplantation and quantify the value of this method of choice in relation to the optimal individualized treatment rule as well as non-individualized treatment strategies.
Keywords: BART; Individualized treatment rules; boosting; optimal ITR; outcome weighted learning; prediction models; random forests; subgroup analysis; value function estimation.
Figures
References
-
- Imai K, Ratkovic M. Estimating treatment effect heterogeneity in randomized program evaluation. Ann Appl Stat. 2013;7(1):443–470. doi: 10.1214/12-AOAS593. doi: 10.1214/12-AOAS593. URL . - DOI
-
- Moodie EE, Dean N, Sun YR. Q-learning: Flexible learning about useful utilities. Statistics in Biosciences. 2014;6(2):223–43.
Publication types
MeSH terms
Grants and funding
LinkOut - more resources
Full Text Sources
Other Literature Sources
