. 2018 Feb;28(2):182-191.
doi: 10.1101/gr.222430.117. Epub 2017 Dec 18.

Transcription factor activity rhythms and tissue-specific chromatin interactions explain circadian gene expression across organs

Affiliations

Transcription factor activity rhythms and tissue-specific chromatin interactions explain circadian gene expression across organs

Jake Yeung et al. Genome Res. 2018 Feb.

Abstract

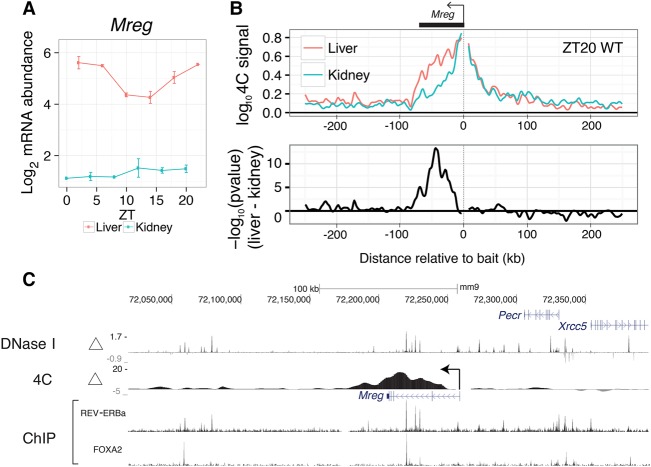
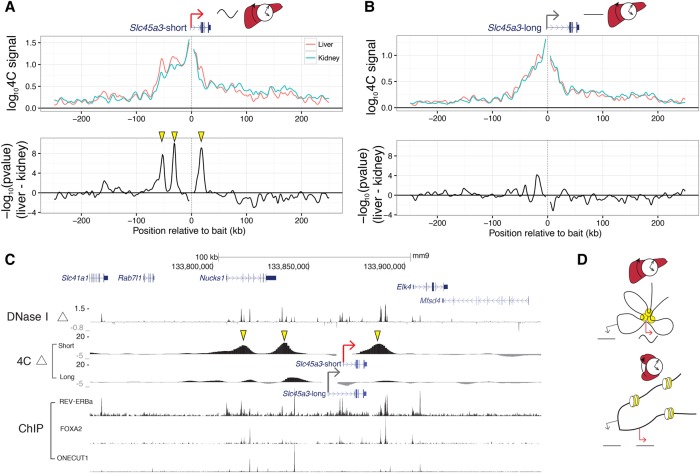
Temporal control of physiology requires the interplay between gene networks involved in daily timekeeping and tissue function across different organs. How the circadian clock interweaves with tissue-specific transcriptional programs is poorly understood. Here, we dissected temporal and tissue-specific regulation at multiple gene regulatory layers by examining mouse tissues with an intact or disrupted clock over time. Integrated analysis uncovered two distinct regulatory modes underlying tissue-specific rhythms: tissue-specific oscillations in transcription factor (TF) activity, which were linked to feeding-fasting cycles in liver and sodium homeostasis in kidney; and colocalized binding of clock and tissue-specific transcription factors at distal enhancers. Chromosome conformation capture (4C-seq) in liver and kidney identified liver-specific chromatin loops that recruited clock-bound enhancers to promoters to regulate liver-specific transcriptional rhythms. Furthermore, this looping was remarkably promoter-specific on the scale of less than 10 kilobases (kb). Enhancers can contact a rhythmic promoter while looping out nearby nonrhythmic alternative promoters, confining rhythmic enhancer activity to specific promoters. These findings suggest that chromatin folding enables the clock to regulate rhythmic transcription of specific promoters to output temporal transcriptional programs tailored to different tissues.


Figures

Figure 1.
Figure 1.
Contribution of tissue, daily time, and circadian clock to global variance in mRNA expression. (A) Principal component analysis (PCA) across 11 WT tissues sampled over 2 d. PC1 and PC2 show clustering of samples by tissues; each point represents a tissue sample (see key) at a specific time point (not labeled). (Inset) Loadings for PC13 and PC17 for the liver samples labeled with circadian time (CT), showing temporal variation along an elliptic path. Labels indicate CT time; samples that are 24 h apart are in the same color. (B) Fractions of temporal variance in each tissue explained by 24- and 12-h periods, obtained by applying spectral analysis genome-wide for each tissue. Dotted horizontal lines represent the expected background level, assuming white noise. (C,D) Cumulative number of rhythmic genes (P < 0.01, harmonic regression) with log2 fold change larger than the value on the x-axis. (C) Analysis on 11 WT tissues. (D) Analysis on four conditions: Bmal1 KO mice and WT littermates in liver and kidney.
Figure 2.
Figure 2.
Combinatorics of rhythmic transcript expression across tissues and genotypes. (A) Schema for the model selection (MS) algorithm to identify rhythmic gene expression modules across tissues. Temporal transcriptomes of different tissues represented as a three-dimensional array (left). Gene modules are probabilistically assigned among different combinations of 24-h rhythms across tissues (e.g., tissue-specific or tissue-wide rhythms schematically shown on right). (B) Gene modules are summarized by the first component of complex-valued singular value decomposition (SVD) to highlight phase (peak time shown as the clockwise angle) and amplitude (log2 fold change shown as the radial distance) relationships between genes (gene space) and between tissues (tissue space). SVD representation is scaled such that the genes show log2 fold changes, while tissue vectors are scaled such that the highest amplitude tissue has length of 1 and a phase offset of 0 h. (CE) MS applied to 11 WT tissues. (C) SVD representation of tissue-wide mRNA rhythms from the 11 tissues. Genes are labeled as system-driven (blue) or clock-driven (red) according to the comparison of the corresponding temporal profiles in Bmal1 KO and WT littermates. (D) Examples of anti-phasic rhythms (brown fat and muscle, n = 20, first SVD component explains 81% of variance), and tissue-specific rhythms (liver, n = 846, first SVD component explains 59% of variance). Representative genes with large amplitudes are labeled. (E) Number of transcripts showing rhythms (P-value < 0.01, harmonic regression) in different numbers of tissues, in function of increasing peak to trough amplitudes on the x-axis. x-axis: average log2 fold change calculated from the identified rhythmic tissues. (F,G) MS applied to Bmal1 KO and WT littermates in liver and kidney. (F) SVD representation of clock- (top, n = 991, 83% of variance) and system-driven (bottom, n = 1395, 84% of variance) liver-specific rhythms. (G) Number of transcripts showing clock- (solid) or system-driven (dotted) rhythms (P-value < 0.01, harmonic regression) in liver (red), kidney (blue), or both (magenta).
Figure 3.
Figure 3.
Oscillatory TF activity in one tissue but not others can drive tissue-specific rhythms. (A) Module describing system-driven liver-specific rhythms (n = 1395, first SVD component explains 84% of variance). Radial coordinate of the colored polygons represents enrichment of the indicated GO terms at each time point, obtained by comparing the genes falling in a sliding window of ±3 h to the background set of all 1395 genes assigned to the module (P-value computed from Fisher's exact test). (B) MAFB is a candidate TF for the module in A. Predicted MAFB activity (blue), nuclear protein abundance (orange triangles), and mRNA accumulation (gray) oscillate in WT and Bmal1 KO, with peak mRNA preceding peak nuclear protein and TF activity. Error bars in nuclear protein, mRNA, and TF activity show SEM (n = 2). (C) Clock-driven kidney-specific module (n = 156, first SVD component explains 80% of variance). Colored polygons as in A. (D) TFCP2 is a candidate TF for the module in C. The temporal profile of predicted TFCP2 activity (blue) is anti-phasic with Tfcp2 mRNA accumulation (gray) in WT, and both are flat in Bmal1 KO. Error bars in mRNA and TF activity show SEM (n = 2). (E) Clock-driven liver-specific module (n = 991, first SVD explains 83% of variance). (F) ELF is a candidate TF for the module in E. The temporal profile of predicted ELF activity (blue) in WT matches that of nuclear protein abundance in liver (orange triangles), and both are delayed compared to Elf1 mRNA accumulation (gray). In Bmal1 KO, ELF activity and Elf1 mRNA are nonrhythmic. Error bars in nuclear protein, mRNA, and TF activity show SEM (n = 2).
Figure 4.
Figure 4.
Colocalized binding of clock- and liver-specific TFs underlies liver-specific mRNA rhythms. (A) The fraction of genes containing liver-specific DNase I hypersensitive sites (DHSs) in the clock-driven liver-specific module is higher compared with both nonrhythmic and system-driven liver-specific modules. Error bars and P-values calculated from 10,000 bootstrap iterations. (B) Predicted temporal activities of RORE (top) and E-box (bottom) TF motifs located within liver-specific DHSs. Error bars show standard deviation of the estimated activities. (C) Co-occurrence of RORE with all other TFs in the SwissRegulon database (Pachkov et al. 2007) (189 TF motifs). Positive log10 odds ratios (ORs) represent pairs of motifs enriched in the clock-driven liver-specific module compared to the flat module. P-values for the motif pairs were calculated from χ2 tests applied to three-way contingency tables (Myšičková et al. 2012). Selected pairs are in bold. (D) DNase I hypersensitivity in liver, kidney, and the corresponding differential signal (in log2 fold change) near two representative genes (top: Insig2; bottom: Slc4a4). RORE, ONECUT1, and FOXA2 TF binding motifs (posterior probability > 0.5, MotEvo) co-occur at liver-specific DHSs (red boxes). Predicted TF binding sites correspond to experimentally observed TF binding in publicly available ChIP-exo data sets for REV-ERBa, ONECUT1, and FOXA2 (bottom).
Figure 5.
Figure 5.
Liver-specific chromatin loops regulate liver-specific mRNA rhythms. (A) Temporal mRNA profile for Mreg, a clock-driven liver-rhythmic gene. Error bars are SEM (n = 2). (B) 4C-seq profiles (summary from two replicates, each pooling two different mice) using the Mreg promoter as a bait in liver and kidney at ZT20. Data are shown in a window of ±250 kb from the bait (top). Profiles of differential contacts between liver and kidney (bottom) represented as signed log P-values (regularized t-test, positive values denote liver-enriched 4C contacts). (C) Tracks of differential 4C contacts (signed log P-values), log2 fold change of DNase I hypersensitivity between liver and kidney, and ChIP-exo of REV-ERBa and FOXA2. Regions of significant differential 4C contacts correspond to liver-specific DNase I hypersensitive regions and REV-ERBa binding sites.
Figure 6.
Figure 6.
Precise promoter-enhancer contacts underlie liver-specific mRNA rhythms. (A,B) 4C-seq profiles for the (A) Slc45a3-short and (B) Slc45a3-long isoforms within ±250 kb around baits targeting the two TSSs (top). Signed log P-values for differential contacts between liver and kidney (bottom) as in Figure 5B. TSSs for Slc45a3-short and Slc45a3-long are 8 kb apart. (C) Differential 4C contacts (signed log P-values), log2 fold change of DNase I hypersensitivity between liver and kidney, and ChIP-exo signal of REV-ERBa, FOXA2, and ONECUT1. Regions of significant differential contacts in Slc45a3-short correspond to liver-specific DNase I hypersensitive regions. Yellow arrowheads in A and C show liver-specific distal contacts recruited to the Slc45a3-short TSS. These contacts are absent for Slc45a3-long TSS (B). (D) Schematic model illustrating enhancer-promoter interactions in liver and kidney that may generate liver-specific rhythms. Yellow circles illustrate liver-active enhancers contacting the rhythmic promoter (red arrow) but not the alternative nonrhythmic promoter (gray arrow). In kidney, the enhancer is not accessible, and both promoters are nonrhythmic.

References

    1. Atger F, Gobet C, Marquis J, Martin E, Wang J, Weger B, Lefebvre G, Descombes P, Naef F, Gachon F. 2015. Circadian and feeding rhythms differentially affect rhythmic mRNA transcription and translation in mouse liver. Proc Natl Acad Sci 112: E6579–E6588. - PMC - PubMed
    1. Balwierz PJ, Pachkov M, Arnold P, Gruber AJ, Zavolan M, van Nimwegen E. 2014. ISMARA: automated modeling of genomic signals as a democracy of regulatory motifs. Genome Res 24: 869–884. - PMC - PubMed
    1. Bass J, Lazar MA. 2016. Circadian time signatures of fitness and disease. Science 354: 994–999. - PubMed
    1. Bhargava A, Herzel H, Ananthasubramaniam B. 2015. Mining for novel candidate clock genes in the circadian regulatory network. BMC Syst Biol 9: 78. - PMC - PubMed
    1. Bozek K, Relógio A, Kielbasa SM, Heine M, Dame C, Kramer A, Herzel H. 2009. Regulation of clock-controlled genes in mammals. PLoS One 4: e4882. - PMC - PubMed

Publication types