. 2018 Feb;28(2):203-213.
doi: 10.1101/gr.225615.117. Epub 2017 Dec 18.

Transcription rate strongly affects splicing fidelity and cotranscriptionality in budding yeast

Affiliations

Transcription rate strongly affects splicing fidelity and cotranscriptionality in budding yeast

Vahid Aslanzadeh et al. Genome Res. 2018 Feb.

Erratum in

Abstract

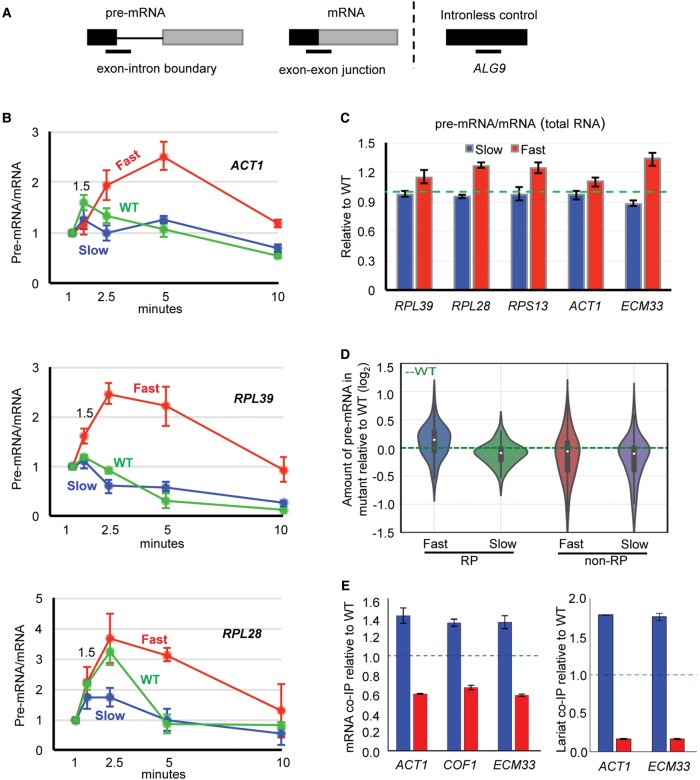
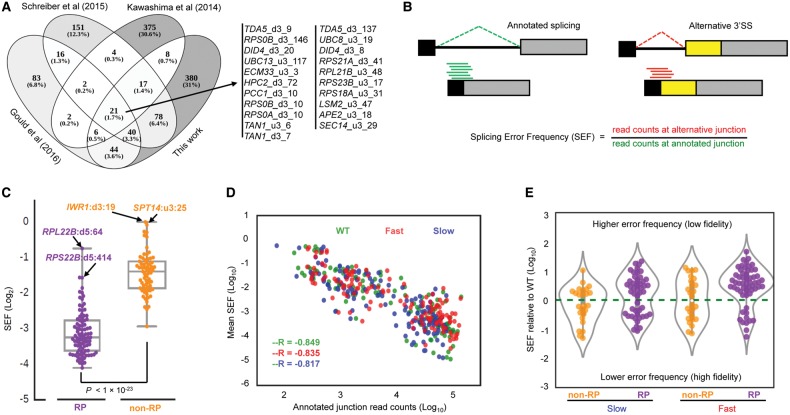
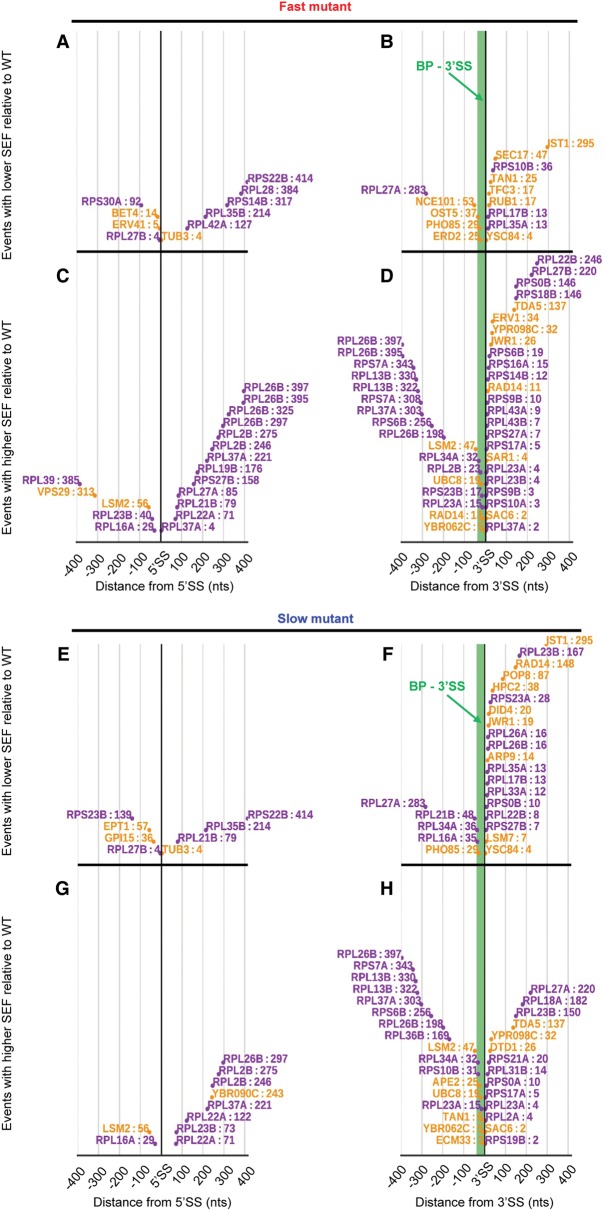
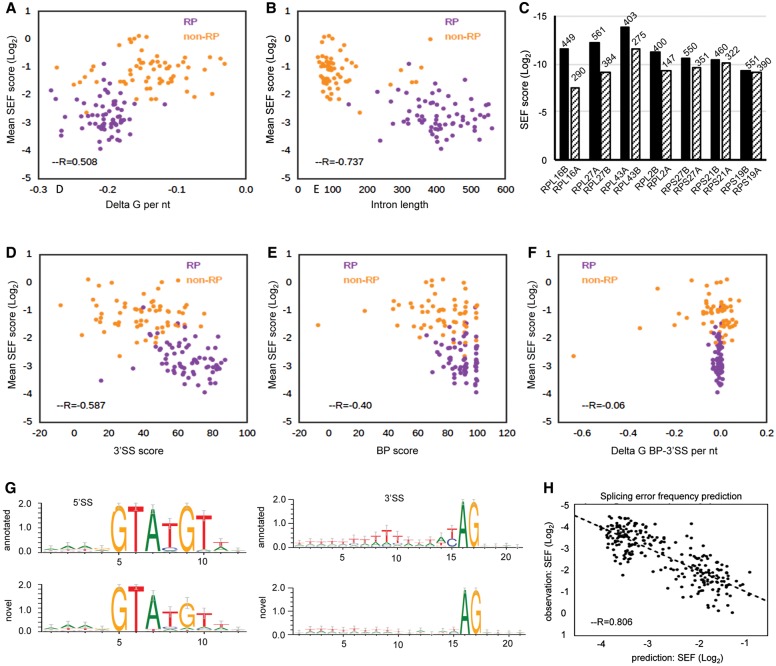
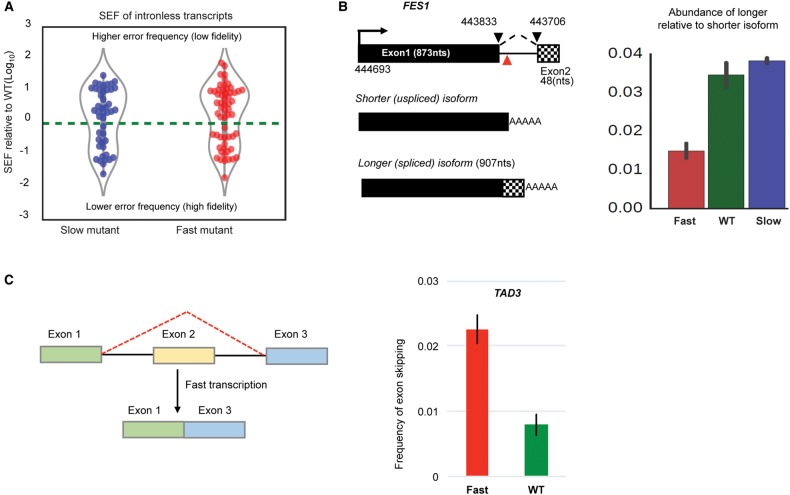
The functional consequences of alternative splicing on altering the transcription rate have been the subject of intensive study in mammalian cells but less is known about effects of splicing on changing the transcription rate in yeast. We present several lines of evidence showing that slow RNA polymerase II elongation increases both cotranscriptional splicing and splicing efficiency and that faster elongation reduces cotranscriptional splicing and splicing efficiency in budding yeast, suggesting that splicing is more efficient when cotranscriptional. Moreover, we demonstrate that altering the RNA polymerase II elongation rate in either direction compromises splicing fidelity, and we reveal that splicing fidelity depends largely on intron length together with secondary structure and splice site score. These effects are notably stronger for the highly expressed ribosomal protein coding transcripts. We propose that transcription by RNA polymerase II is tuned to optimize the efficiency and accuracy of ribosomal protein gene expression, while allowing flexibility in splice site choice with the nonribosomal protein transcripts.


Figures

Figure 1.
Figure 1.
Fast elongation reduces and slow elongation enhances cotranscriptional splicing. (A) Diagram showing the location of RT-qPCR amplicons (lines below) for measuring pre-mRNA (exon–intron boundary at the 5′SS) and mRNA (exon–exon junction) levels. Black and gray boxes represent exons of intron-containing transcript or coding sequence of intron-less transcript (ALG9). (B) RT-qPCR results showing pre-mRNA/mRNA ratio for ACT1, RPL39, and RPL28 in fast (red), slow (blue), and WT (green) strains. To correct for amount of input RNA, values for pre-mRNA and mRNA were separately normalized to an intron-less transcript (ALG9) in the same sample. 4tU labeling was performed for 1, 1.5, 2.5, 5, and 10 min (x-axis), with all values plotted relative to the 1-min value. (C) Pre-mRNA/mRNA ratio of steady-state RNA for fast and slow mutants relative to WT (green dotted line). Error bars, at least three biological replicates. (D) Amount of pre-mRNA in the fast and the slow mutant relative to WT for RP and non-RP transcripts, measured by DICEseq (Huang and Sanguinetti 2016) from RNA sequencing data. (E) Fold enrichment of mRNA (left) and lariat-intron (right) association with RNAPII, in slow (blue) or fast (red) mutants relative to WT (green dotted line), measured by RT-qPCR. To correct for differences in the amount of RNA pull down, values for mRNA and lariat were separately normalized to RT-qPCR values for an intron-less transcript (ALG9). Error bars, three biological replicates.
Figure 2.
Figure 2.
Changes in splicing error frequency (SEF) in fast and slow strains. (A) Overlap between novel splicing events found in this work with those in recent reports. We do not detect some of the events reported in the other studies most likely because we filter out events with fewer than five supporting reads (see text). Kawashima et al. (2014) reported any event detected with one or more supporting read. Schreiber et al. (2015) reported events supported by at least three reads. Gould et al. (2016) calculated an entropy value for each junction and reported all the events with entropy ≥2 bits. (B) Diagram showing how SEF of novel splicing events was measured using an alternative upstream 3′SS event as an example. (C) Distribution of the SEF in RP (purple) and non-RP (orange) intron-containing transcripts in the WT strain. Events with high SEF are highlighted (u3 and d3 are alternative upstream and downstream 3′SS, and d5 is alternative downstream 5′SS; numbers indicate the distance in nucleotides). The P-value was obtained by t-test. (D) Negative correlation between mRNA (both RP and non-RP) abundance and average SEF in fast (red), slow (blue), and WT (green). mRNA abundance was estimated from the number of reads aligned to the exon–exon junctions. –R is Pearson's correlation coefficient. P-values for each strain were as follows: fast, P < 1 × 10⁻³³; slow, P < 1 × 10⁻³¹; and WT, P < 1 × 10−38. (E) Violin plot showing distribution of SEF of non-RP and RP intron-containing transcripts in fast and slow mutants normalized to WT. This plot includes all novel splicing events whose SEF was significantly different in mutants relative to WT (Fisher's exact test; P < 0.01, FDR < 0.03). Points above dashed line (zero) are novel events with higher SEF than WT (reduced fidelity); points below dashed line are novel events with lower SEF than WT (improved splicing fidelity).
Figure 3.
Figure 3.
Distribution of the novel splice sites in RP (purple) and non-RP (orange) intron-containing transcripts whose SEF is significantly different in the fast and slow mutants relative to WT (P < 0.01). (A,B) Alternative 5′SS and 3′SS splicing events whose fidelity increased with the fast mutant. (C,D) Alternative 5′SS and 3′SS splicing events whose fidelity reduced with the fast mutant. (E,F) Alternative 5′SS and 3′SS splicing events whose fidelity increased with the slow mutant. (G,H) Alternative 5′SS and 3′SS splicing events whose fidelity reduced with the slow mutant. Green region upstream of 3′SS is the mean distance between BP and annotated 3′SS in budding yeast (∼37 nt).
Figure 4.
Figure 4.
Features associated with SEF. Orange points represent novel events in non-RP transcripts, and purple points denote RP transcripts. (A) Positive correlation between delta G of intron (see Methods) and mean SEF of the transcripts. Delta G of intron was divided by the intron length to achieve delta G per nucleotide. More negative delta G values represent more structured introns. (B) Negative correlation between intron length and mean SEF. (C) Mean SEF of seven pairs of paralogs. Paralogs with shorter intron length (IL) have higher SEF. (D) Negative correlation between 3′SS score (see Methods) and mean SEF. The score expresses how similar the splice sites are to the budding yeast 3′SS consensus. (E) Weak negative correlation between BP score and mean SEF. (F) Absence of correlation between delta G of BP-3′SS region and mean SEF. Delta G was divided by the distance between BP and 3′SS to achieve delta G per nucleotide (G) Sequence logos were generated for 5′SSs and 3′SSs of all novel alternative splicing events. For annotated introns, sequence logos were generated only from splice sites of transcripts that had novel alternative splicing events. (H) Correlation between observed and predicted SEF (as described in Methods).
Figure 5.
Figure 5.
(A) Violin plots show the occurrence of cryptic splicing events within intron-less transcripts in the slow and fast mutants relative to WT. This plot includes all novel splicing events with significantly different SEF in mutants relative to WT (Fisher's exact test; P < 0.01). Points above the dashed line (zero) are splicing events with SEF greater than WT (reduced fidelity). Points below the dashed line are the events with improved splicing fidelity compared with WT. (B) Splicing of FES1 intron. Intron (ends connected by dashed lines) is 128 nt, and red triangle sign shows where promotor proximal polyadenylation occurs. Splicing of the intron generates a longer isoform. Barplot shows relative abundance of the longer (spliced) isoform relative to shorter isoform, measured by dividing junction read counts of longer isoform over FPKM of the shorter isoform. (C) Second exon skipping in TAD3 transcript with the fast mutant. To calculate frequency of exon skipping, the number of exon1–exon3 junction (exon skipping) reads was divided by the number of exon1–exon2 junction (first intron splicing) reads. A similar result is obtained by dividing by the number of exon2–exon3 junction reads.

References

    1. Alexander RD, Barrass JD, Dichtl B, Kos M, Obtulowicz T, Robert M-C, Koper M, Karkusiewicz I, Mariconti L, Tollervey D, et al. 2010a. RiboSys, a high-resolution, quantitative approach to measure the in vivo kinetics of pre-mRNA splicing and 3′-end processing in Saccharomyces cerevisiae. RNA 16: 2570–2580. - PMC - PubMed
    1. Alexander RD, Innocente SA, Barrass JD, Beggs JD. 2010b. Splicing-dependent RNA polymerase pausing in yeast. Mol Cell 40: 582–593. - PMC - PubMed
    1. Ameur A, Zaghlool A, Halvardson J, Wetterbom A, Gyllensten U, Cavelier L, Feuk L. 2011. Total RNA sequencing reveals nascent transcription and widespread co-transcriptional splicing in the human brain. Nat Struct Mol Biol 18: 1435–1440. - PubMed
    1. Ares M, Grate L, Pauling MH. 1999. A handful of intron-containing genes produces the lion's share of yeast mRNA. RNA 5: 1138–1139. - PMC - PubMed
    1. Barrass JD, Reid JEA, Huang Y, Hector RD, Sanguinetti G, Beggs JD, Granneman S. 2015. Transcriptome-wide RNA processing kinetics revealed using extremely short 4tU labeling. Genome Biol 16: 282. - PMC - PubMed

Publication types