Review
. 2018 Feb;176(2):1039-1048.
doi: 10.1104/pp.17.01437. Epub 2017 Dec 18.

Phytochrome, Carbon Sensing, Metabolism, and Plant Growth Plasticity

Affiliations
Review

Phytochrome, Carbon Sensing, Metabolism, and Plant Growth Plasticity

Johanna Krahmer et al. Plant Physiol. 2018 Feb.

Abstract

Phytochrome signaling controls biomass accumulation, growth plasticity, and metabolism.


Figures
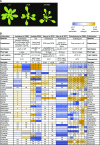
Figure 1.
Figure 1.
Phytochrome affects biomass, plant architecture, and carbon metabolism. A, Images of Arabidopsis Landsberg erecta wild type (Ler) and the phytochrome mutants phyB and phyABD. B, Lack of phytochrome signaling leads to enhanced levels of several organic acids, sugars, and amino acids in most studies. The heat map visualizes fold changes in soluble metabolite content in phytochrome mutants and the prr975 mutant compared with wild-type (WT) controls, or in response to low R-FR ratio, as seen in gas chromatography-mass spectrometry (GC-MS) data sets (Jumtee et al., 2008, 2009; Fukushima et al., 2009; Yang et al., 2016; Han et al., 2017). Fold changes were calculated by dividing the metabolite content of the mutant (or low R-FR ratio-treated plants) by that of the wild type (or high R-FR-treated plants). For Jumtee et al. (2008), values at 24 h after the start of FR or white light treatment were first normalized by the respective dark control of each genotype at the same time point, and then fold change of phyA over the wild type was determined from these values. Experimental setup, samples, and conditions for each study are indicated above the heat map. Fold changes are indicated in colors, with dark blue representing the largest decrease and dark orange representing the largest increase in the mutant over the wild type, or low R-FR over high R-FR ratio. The values of the 5th and 95th percentiles were used as minimum and maximum values, respectively. + and − indicate statistically significant increase and decrease, respectively, according to the statistics employed in each study. EOD, End of day; EON, end of night; LD, light-dark; D, dark; YL, young leaf; ML, mature leaf; na, data are not available for this metabolite. Numbers for Fukushima et al. (2009) indicate time of sampling after light onset in the morning in hours.
None
None

References

    1. Boccalandro HE, Rugnone ML, Moreno JE, Ploschuk EL, Serna L, Yanovsky MJ, Casal JJ (2009) Phytochrome B enhances photosynthesis at the expense of water-use efficiency in Arabidopsis. Plant Physiol 150: 1083–1092 - PMC - PubMed
    1. Casal JJ. (2012) Shade avoidance. The Arabidopsis Book 10: e0157, - PMC - PubMed
    1. Chan KX, Phua SY, Crisp P, McQuinn R, Pogson BJ (2016) Learning the languages of the chloroplast: retrograde signaling and beyond. Annu Rev Plant Biol 67: 25–53 - PubMed
    1. Chen X, Yao Q, Gao X, Jiang C, Harberd NP, Fu X (2016) Shoot-to-root mobile transcription factor HY5 coordinates plant carbon and nitrogen acquisition. Curr Biol 26: 640–646 - PubMed
    1. Chew YH, Wenden B, Flis A, Mengin V, Taylor J, Davey CL, Tindal C, Thomas H, Ougham HJ, de Reffye P, et al. (2014) Multiscale digital Arabidopsis predicts individual organ and whole-organism growth. Proc Natl Acad Sci USA 111: E4127–E4136 - PMC - PubMed

Publication types

MeSH terms

LinkOut - more resources