. 2018 Jan 2;115(1):162-167.
doi: 10.1073/pnas.1716527115. Epub 2017 Dec 18.

C-terminal modification of the insulin B:11-23 peptide creates superagonists in mouse and human type 1 diabetes

Affiliations

C-terminal modification of the insulin B:11-23 peptide creates superagonists in mouse and human type 1 diabetes

Yang Wang et al. Proc Natl Acad Sci U S A. .

Abstract

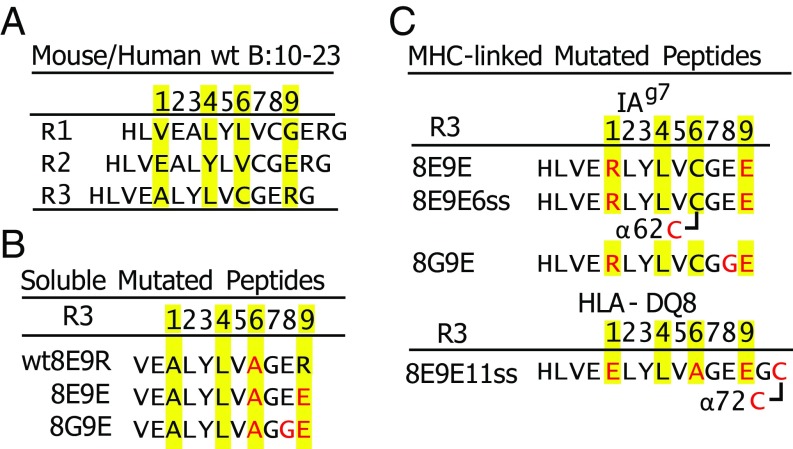
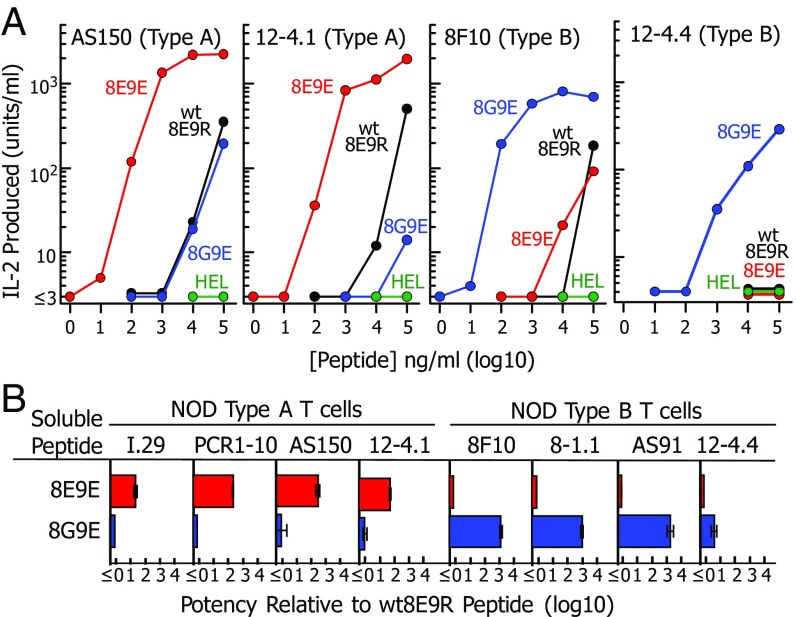
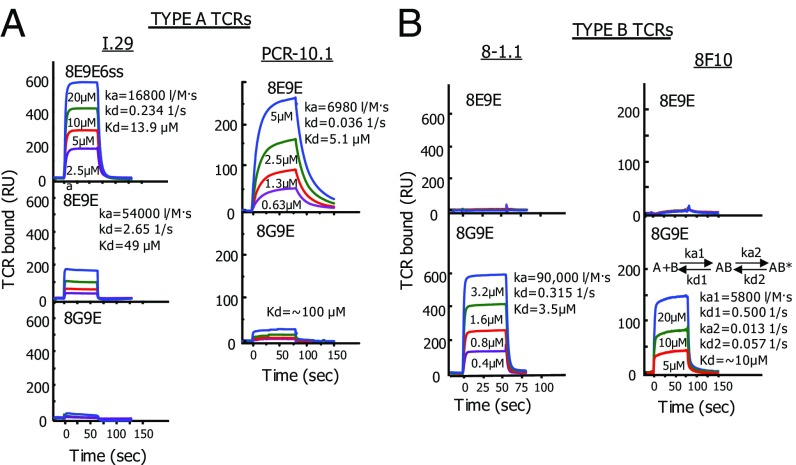
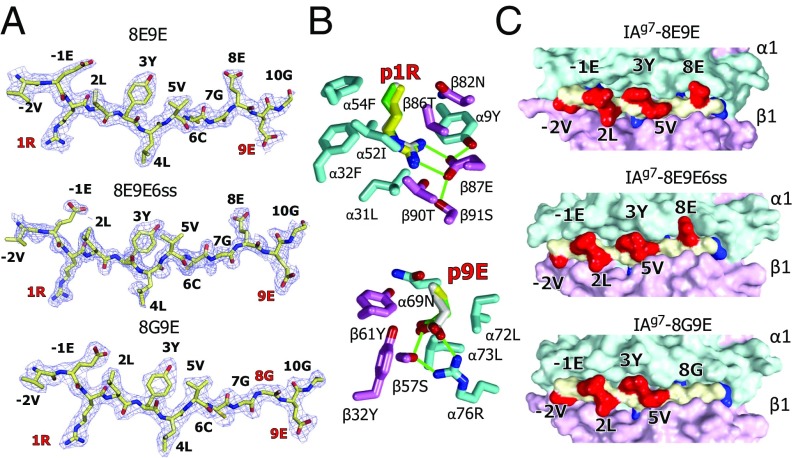
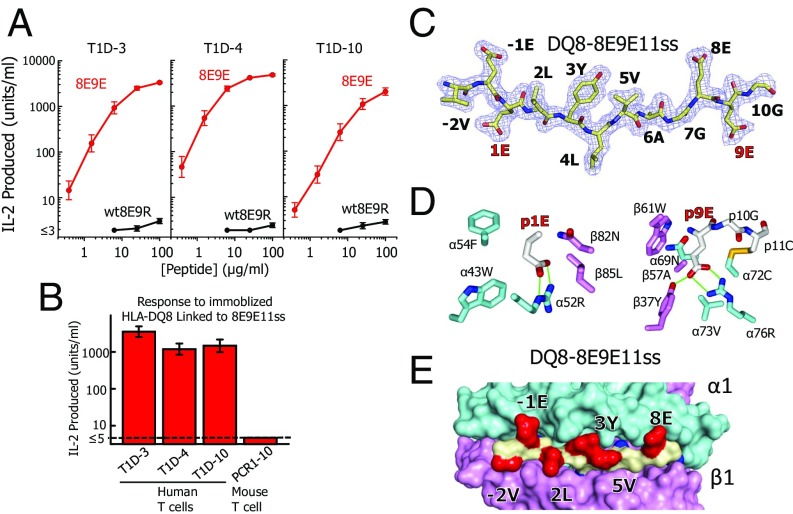
A polymorphism at β57 in some major histocompatibility complex class II (MHCII) alleles of rodents and humans is associated with a high risk for developing type 1 diabetes (T1D). However, a highly diabetogenic insulin B chain epitope within the B:9-23 peptide is presented poorly by these alleles to a variety of mouse and human CD4 T cells isolated from either nonobese diabetic (NOD) mice or humans with T1D. We have shown for both species that mutations at the C-terminal end of this epitope dramatically improve presentation to these T cells. Here we present the crystal structures of these mutated peptides bound to mouse IAg7 and human HLA-DQ8 that show how the mutations function to improve T-cell activation. In both peptide binding grooves, the mutation of B:22R to E in the peptide changes a highly unfavorable side chain for the p9 pocket to an optimal one that is dependent on the β57 polymorphism, accounting for why these peptides bind much better to these MHCIIs. Furthermore, a second mutation of the adjacent B:21 (E to G) removes a side chain from the surface of the complex that is highly unfavorable for a subset of NOD mouse CD4 cells, thereby greatly enhancing their response to the complex. These results point out the similarities between the mouse and human responses to this B chain epitope in T1D and suggest there may be common posttranslational modifications at the C terminus of the peptide in vivo to create the pathogenic epitopes in both species.

Keywords: autoimmunity; peptide presentation; posttranslational modification; self-tolerance.


Conflict of interest statement

The authors declare no conflict of interest.

Figures

Fig. 1.
Fig. 1.
Various versions of the insulin B:9–23 peptide used in these studies. (A) Three of the possible Rs (R1–R3) for the binding of the B:10–23 peptide within the IAg7 or DQ8 binding groove. Predicted anchor amino acids at p1, p4, p6, and p9 are highlighted in yellow. (B) Mutated soluble versions of the B:12–22 peptide are shown with the mutations in red. Predicted R3 anchor amino acids are highlighted in yellow. (C) Various versions of the B:10–22 peptide covalently bound to IAg7 or DQ8 via a linker between the peptide C termini and the N termini of the MHCII β chain. Mutations within the peptide, linker, or MHCII α chain are in red. Disulfide bonds between the peptide/linker and MHCII α chain are indicated. See Materials and Methods for details of the constructions.
Fig. 2.
Fig. 2.
Mutations to the B:12–22 peptide create reciprocal superagonists for type A vs. type B insulin-reactive T cells. (A) Various concentrations of soluble WT8E9R (black), 8E9E (red), and 8G9E (blue) peptides (Fig. 1B) were presented by fixed M12.C3-IAg7 cells to two NOD mouse type A and two type B insulin-reactive T cells (Table S1). Results of a single experiment are presented as IL-2 produced after 24 h vs. the concentration of the offered peptide. The HEL peptide was used as a negative control (green). (B) Peptide titration experiments were performed as in A with all eight NOD mouse T cells listed in Table S1. The titration data were fitted with parallel third-order polynominal curves. The peptide potency was defined as the shift in the titration curve relative to that of the WT8E9R peptide. Results are shown as the geometric average and SEM of three separate experiments.
Fig. 3.
Fig. 3.
Binding of soluble type A and type B TCRs to IAg7–peptide complexes parallels the peptide stimulation activities. (A) The affinities of soluble TCRs from two type A T cells (I.29 and PCR1-10) for IAg7 bearing various mutated insulin B:10–22 peptides were evaluated using SPR. Approximately 2,000 RUs of the biotinylated IAg7 peptides were immobilized in flow cells of a streptavidin containing BIAsensor chip. Biotinylated IAg7-HEL was immobilized in a separate flow cell to correct for the fluid phase SPR signal. The indicated concentrations of the soluble TCRs were injected for ∼75 s and the binding and dissociation of the TCRs followed by the SPR signal (RU). Where there was sufficient binding, kinetics (ka, kd, and Kd) were calculated using standard BIAevalution 4 software. B is similar to A, except the soluble TCRs came from two type B T cells (8-1.1 and 8F10). The 8F10 TCR showed second-order binding kinetics best represented by the equation shown. See Discussion.
Fig. 4.
Fig. 4.
Crystal structures show very similar R3 binding of the mutated peptides to IAg7. (A) 2Fo−Fc electron density maps contoured at 1 σ within 1.5 Å of the 8E9E, 8E9E6ss, and 8G9E peptides bound to IAg7 are shown with the amino acid at each position in the MHCII binding groove labeled. The mutated amino acids are labeled in red. (B) Wireframe representations of the p1 pocket (Above) and p9 pocket (Below) of IAg7–8E9E are shown with oxygen, red and nitrogen, blue. Carbons are colored as follows: peptide, white; α chain, cyan; β chain, magenta. The side chains of p1R and p9E from the other two structures are shown superimposed, 8E9E6ss (carbons, yellow) and 8G9E (carbons, green). H bonds and salt bridges are shown with green lines. (C) Water-accessible surfaces of the IAg7 complexes are shown (α chain, cyan; β chain, magenta; peptide backbone, yellow; peptide exposed side chains, red; peptide buried side chains, blue). Exposed amino acids p-2, p-1, p2, p3, p5, and p8 are labeled.
Fig. 5.
Fig. 5.
DQ8 also binds and presents the mutant insulin peptide in R3. (A) Various concentrations of soluble WT8E9R (black) and 8E9E (red) peptides (Fig. 1B) were presented by fixed M12.C3-DQ8 cells to three human type A insulin-reactive T cells (Table S1). Results of a single experiment are presented as IL-2 produced after 24 h vs. the concentration of the offered peptide. Similar results were obtained in a second experiment. (B) A biotinylated soluble version of the DQ8-8E9E11ss was immobilized in culture wells coated with Extravidin (Sigma). The same three insulin-reactive human T cells were added and IL-2 production assayed at 24 h. A mouse T cell (PCR1-10), highly reactive to the same peptide bound to IAg7, was used as the negative control. (C) 2Fo−Fc electron density maps contoured at 1 σ within 1.5 Å of the 8E9E11ss peptide bound to DQ8 are shown with the amino acid at each position in the MHCII binding groove labeled. The mutated amino acids are labeled in red. (D) Wireframe representations of the p1 pocket (Left) and p9 pocket (Right) of DQ8-8E9E11ss complex are shown colored as in Fig. 4C. H bonds and salt bridges are shown as green lines. The disulfide is shown (yellow) between the introduced cysteines at p11 and DQ8 α72. (E) Water-accessible surface of the DQ8-8E9E11ss complex is shown (α chain, cyan; β chain, magenta; peptide backbone, yellow; peptide exposed side chains, red; peptide buried side chains, blue). Exposed amino acids p-2, p-1, p2, p3, p5, and p8 are labeled.

Similar articles

Cited by

References

    1. Aly TA, et al. Genetic prediction of autoimmunity: Initial oligogenic prediction of anti-islet autoimmunity amongst DR3/DR4-DQ8 relatives of patients with type 1A diabetes. J Autoimmun. 2005;25(Suppl):40–45. - PubMed
    1. Stadinski B, Kappler J, Eisenbarth GS. Molecular targeting of islet autoantigens. Immunity. 2010;32:446–456. - PubMed
    1. Mordes JP, Bortell R, Blankenhorn EP, Rossini AA, Greiner DL. Rat models of type 1 diabetes: Genetics, environment, and autoimmunity. ILAR J. 2004;45:278–291. - PubMed
    1. Concannon P, Rich SS, Nepom GT. Genetics of type 1A diabetes. N Engl J Med. 2009;360:1646–1654. - PubMed
    1. Hu X, et al. Additive and interaction effects at three amino acid positions in HLA-DQ and HLA-DR molecules drive type 1 diabetes risk. Nat Genet. 2015;47:898–905. - PMC - PubMed

Publication types

MeSH terms